> ## Documentation Index
> Fetch the complete documentation index at: https://docs.bigdata.com/llms.txt
> Use this file to discover all available pages before exploring further.
# bigdata_computer
> Run Python in a secure sandbox with authenticated access to Bigdata.com data, and return only the computed insights to the agent.
## Overview
The other Bigdata.com MCP tools each return a fixed set of information. A tearsheet, for example, always returns the same data points for a company, limited to the time frame and scope built into the tool. That works well for common questions, but it has two drawbacks:
* **Limited reach:** If the data point or time period you need is not part of the tool's response, the agent cannot get it.
* **Context window overload:** For many use cases the response is broader than needed. The agent receives large payloads it does not use, which fills its context window and leaves less room for reasoning.
`bigdata_computer` solves both problems. It runs Python in a sandbox connected to Bigdata.com through an authenticated client, so the agent can:
* **Reach any data point:** Query the [Bigdata.com API](/api-rest/introduction) endpoints directly and request exactly the data and time range the question needs, point in time.
* **Compute before returning:** Filter, aggregate, rank, and calculate inside the sandbox, so only the final insight reaches the agent instead of the raw data.
The result is deterministic: ratios, screens, and comparisons are calculated by code, not estimated by the language model.
## When to Use
`bigdata_computer` is ideal for:
* **Calculations across companies:** Comparing ratios such as gross margin or revenue growth across a peer group
* **Screens over a watchlist:** Ranking or filtering a list of companies by price returns, fundamentals, or other metrics
* **Custom time ranges:** Pulling prices, financials, or search volume for the exact periods a question requires
* **Multi-step analysis:** Loading and cleaning data once, then reshaping, comparing, and charting it in later steps
* **Charts:** Rendering a chart from the computed data
Use the specialized tools, such as [`bigdata_company_tearsheet`](/mcp-reference/tools/bigdata-company-tearsheet) or [`bigdata_search`](/mcp-reference/tools/bigdata-search), when their standard output answers the question. Use `bigdata_computer` when the question needs data or calculations those tools do not provide.
## Available Data
Inside the sandbox, the agent can access:
* Prices and returns
* Company fundamentals and financials
* Company profiles and peers
* Search aggregations, such as co-mentions and volume over time
* Entity lookup by name or ticker
* Fund and portfolio holdings
* Chart rendering
`pandas` and `numpy` are preloaded.
## How It Works
1. **Write a cell:** The agent sends Python code with a short `intent` describing its goal, for example "Compare NVIDIA and AMD gross margins"
2. **Run in the sandbox:** The code fetches data through the client and computes the result
3. **Return the output:** Only what the cell prints comes back to the agent, never the value of its last expression
4. **Continue the session:** The agent passes the returned `session_id` on later calls, so new cells can reuse the variables, dataframes, and files created earlier
5. **Close the session:** On the last cell, the agent sets `close_session` to `true` to free the sandbox
## Example
### Prompt
```text theme={null}
Ask bigdata to screen public companies in the US, Europe, China, and Japan in the robotics industry with a market cap higher than $5bn. Pull 3 years of quarterly income statements to visualize their revenue, earnings, free cash flow, and operating expenses.
```
### Output
The agent explains how it built the screen, lists the resulting companies by region, and summarizes the main points.
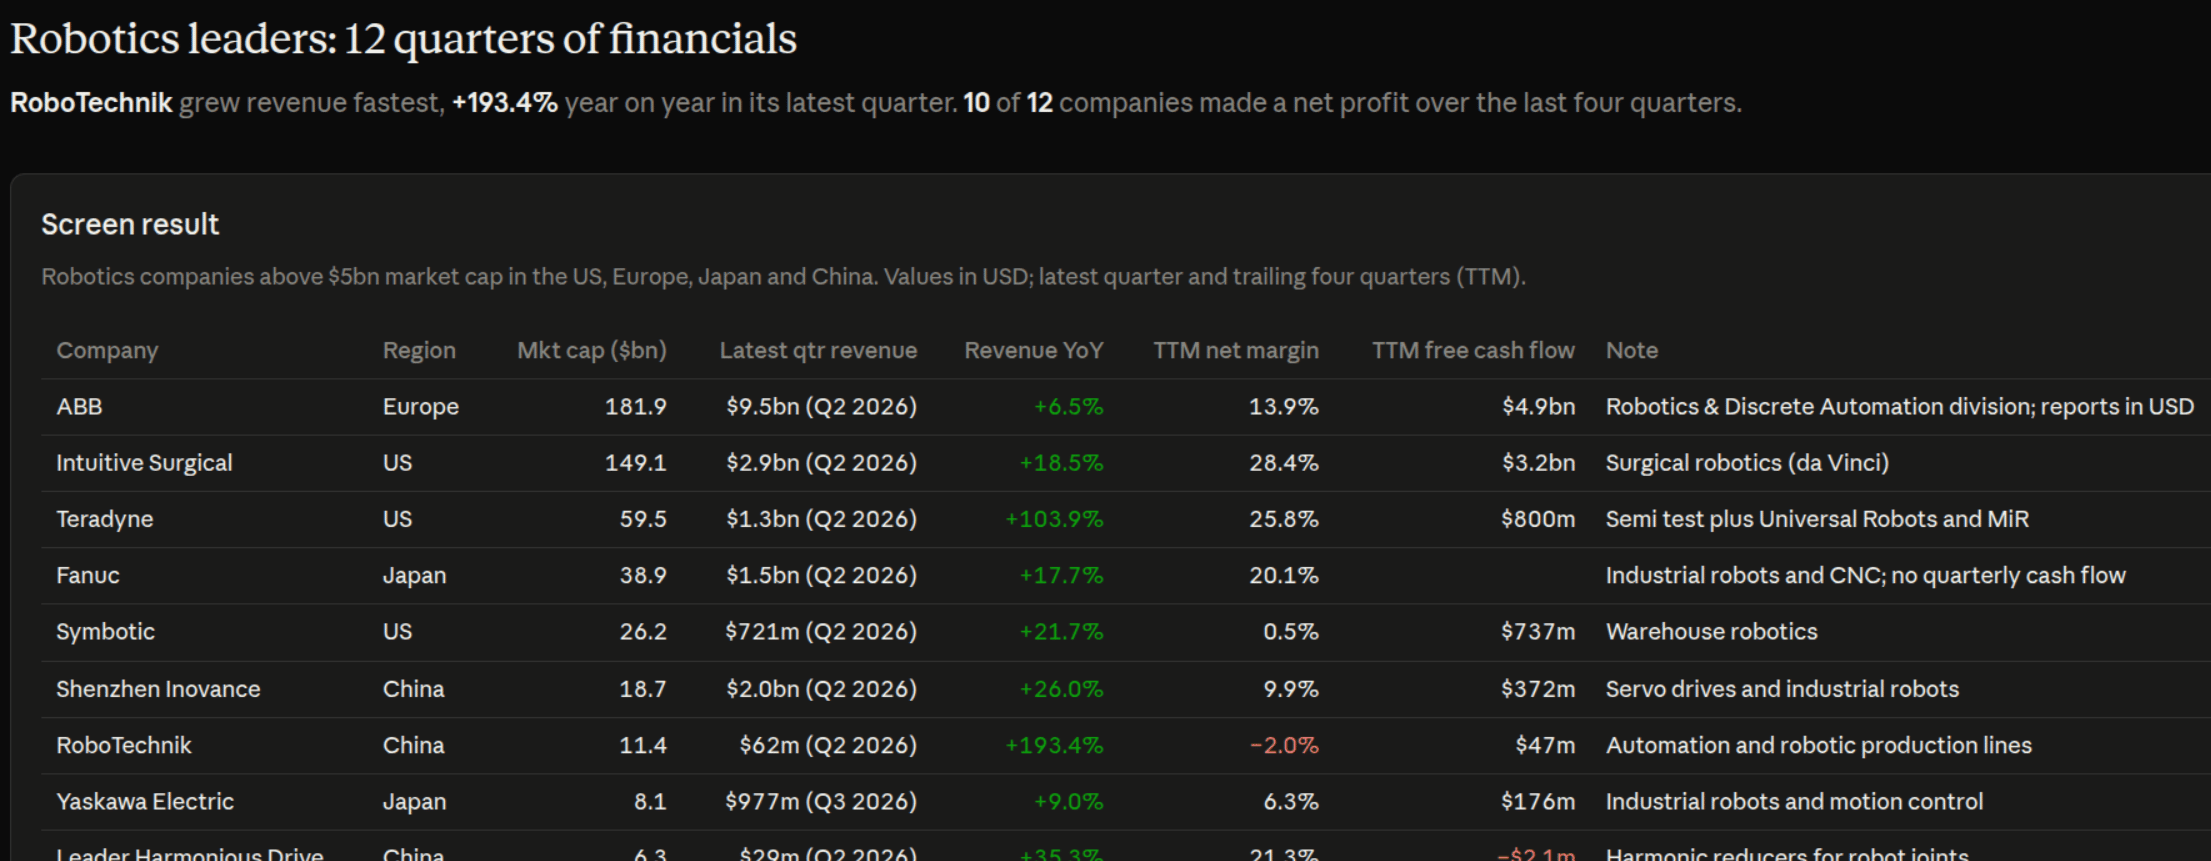
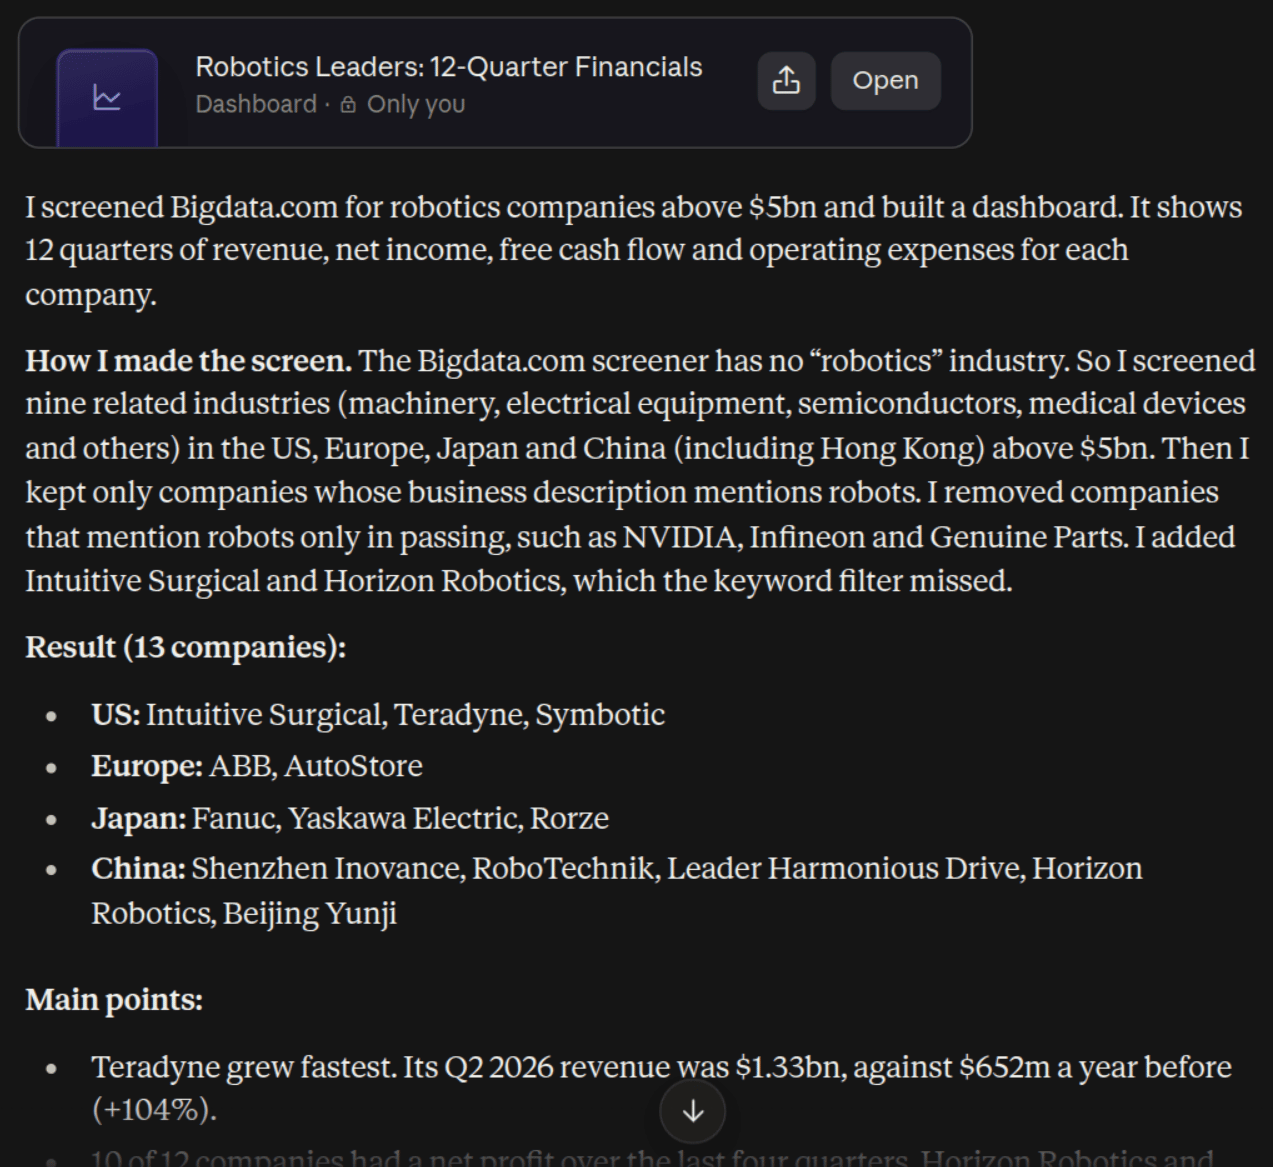 The agent builds a dashboard with the screen results and 12 quarters of financials for each company.
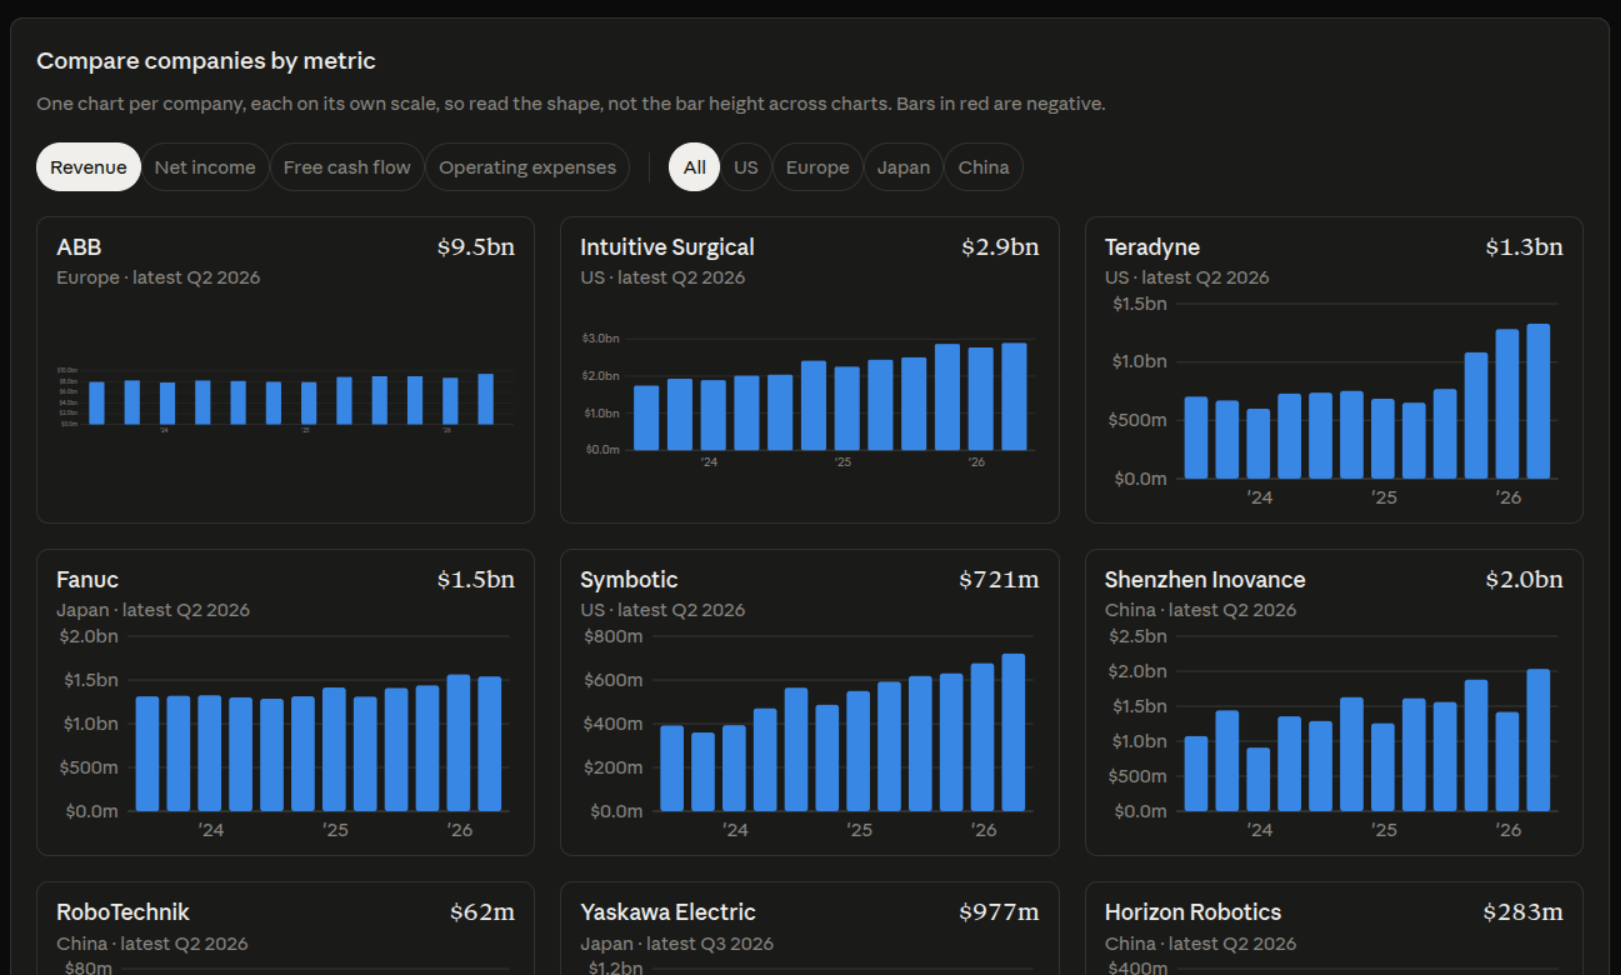
 Each company has its own chart, which you can filter by metric and region.
 ## Parameters
| Parameter | Type | Required | Description |
| - | - | - | - |
| `code` | string | Yes | Python to run in the sandbox, up to 100,000 characters. Print the results to return. |
| `intent` | string | Yes | One short line, up to 200 characters, describing the goal of the cell as the user would recognize it. It is shown above the code. |
| `session_id` | string | No | The `session_id` from the previous result. Omit it on the first call to start a new session. Calls without it start a new, empty sandbox. |
| `close_session` | boolean | No | If `true`, the session ends after the cell runs and its output is returned. Default `false`. |
## Data Returned
| Field | Description |
| - | - |
| `session_id` | Identifier of the sandbox session, to pass on later calls |
| `success` | Whether the cell ran without errors |
| `stdout` | Everything the cell printed |
| `stderr` | Error output from the cell |
| `error` | A summary line when the cell failed |
| `session_expires_at` | Exact expiry time, returned on the call that opened the session |
## Sessions
A session is a live sandbox that keeps the variables, functions, dataframes, and files created by earlier cells. This makes multi-step work efficient: the data is fetched once and reused in later steps.
### Important Notes
* A session lasts about **30 minutes** from the moment it opens. Running cells does not extend it
* When a session expires or is closed, everything in it is destroyed and the `session_id` stops working
* Each open session counts against a limit of open sessions per user, so close sessions when the work is done
* Sessions are isolated: nothing written in one session is visible to other users or conversations
## Practical Tips
### Print as you go
Only printed output comes back, and the session is destroyed when it ends. Print intermediate results in each cell instead of leaving them in variables to read later.
### Split long work into batches
The agent platform may stop waiting for a response before a long cell finishes. For large pulls, such as years of prices for hundreds of companies, fetch the data in batches across several cells in the same session, keeping each batch in a variable.
### Scope of use
`bigdata_computer` is designed for the analysis the user asks for, on the data the client exposes. It is not a general-purpose computer and does not allow bulk data extraction or access to anything beyond the [Bigdata.com public APIs](/api-rest/introduction).
This documentation is built and hosted on [Mintlify](https://mintlify.com), a developer documentation platform.
## Parameters
| Parameter | Type | Required | Description |
| - | - | - | - |
| `code` | string | Yes | Python to run in the sandbox, up to 100,000 characters. Print the results to return. |
| `intent` | string | Yes | One short line, up to 200 characters, describing the goal of the cell as the user would recognize it. It is shown above the code. |
| `session_id` | string | No | The `session_id` from the previous result. Omit it on the first call to start a new session. Calls without it start a new, empty sandbox. |
| `close_session` | boolean | No | If `true`, the session ends after the cell runs and its output is returned. Default `false`. |
## Data Returned
| Field | Description |
| - | - |
| `session_id` | Identifier of the sandbox session, to pass on later calls |
| `success` | Whether the cell ran without errors |
| `stdout` | Everything the cell printed |
| `stderr` | Error output from the cell |
| `error` | A summary line when the cell failed |
| `session_expires_at` | Exact expiry time, returned on the call that opened the session |
## Sessions
A session is a live sandbox that keeps the variables, functions, dataframes, and files created by earlier cells. This makes multi-step work efficient: the data is fetched once and reused in later steps.
### Important Notes
* A session lasts about **30 minutes** from the moment it opens. Running cells does not extend it
* When a session expires or is closed, everything in it is destroyed and the `session_id` stops working
* Each open session counts against a limit of open sessions per user, so close sessions when the work is done
* Sessions are isolated: nothing written in one session is visible to other users or conversations
## Practical Tips
### Print as you go
Only printed output comes back, and the session is destroyed when it ends. Print intermediate results in each cell instead of leaving them in variables to read later.
### Split long work into batches
The agent platform may stop waiting for a response before a long cell finishes. For large pulls, such as years of prices for hundreds of companies, fetch the data in batches across several cells in the same session, keeping each batch in a variable.
### Scope of use
`bigdata_computer` is designed for the analysis the user asks for, on the data the client exposes. It is not a general-purpose computer and does not allow bulk data extraction or access to anything beyond the [Bigdata.com public APIs](/api-rest/introduction).
This documentation is built and hosted on [Mintlify](https://mintlify.com), a developer documentation platform.