> ## Documentation Index
> Fetch the complete documentation index at: https://docs.bigdata.com/llms.txt
> Use this file to discover all available pages before exploring further.
# Risk Analyzer
> Identifying Corporate Exposure to Risks
## Why It Matters
Understanding how companies are exposed to highly uncertain scenarios and risk channels, like geopolitical and economic risks, is critical for informed decision-making. As shifting policies, sanctions, and trade barriers redefine market dynamics, organizations must proactively assess their vulnerability to emerging threats.
## What It Does
The `RiskAnalyzer` class, part of the `bigdata-research-tools` package, is purpose-built to meet this challenge. Designed for risk analysts, portfolio managers, and investment professionals, it systematically analyzes corporate exposure to specific risk channels using unstructured data from news, earnings calls, and regulatory filings.
## How It Works
The `RiskAnalyzer` combines **hybrid semantic search**, **risk factor taxonomies**, and **structured validation techniques** to deliver:
* **Targeted extraction of risk signals** and supporting evidence from massive unstructured datasets
* **Standardized exposure metrics** to compare risk across firms, sectors, or portfolios
* **Actionable insights** that inform investment strategies and enterprise risk decisions
* **Time-based monitoring** to track how exposure levels shift in response to world events
## A Real-World Use Case
This cookbook illustrates the full workflow through a practical example: identifying companies impacted by new U.S. import tariffs on China. You'll learn how to convert unstructured narrative (news articles) into structured, quantifiable risk intelligence.
**Ready to get started? Let's dive in!**


## Prerequisites
To run the Risk Analyzer workflow, you can choose between three options:
* ▶️ **Colab cookbook**
* Use this if you prefer running the workflow in a cloud environment.
* Follow the instructions written directly inside the cookbook.
* API keys must be configured as described within the Colab file itself.
* 💻 **GitHub cookbook**
* Use this if you prefer working locally or in a custom environment.
* Follow the setup and execution instructions in the [`README.md`](https://github.com/Bigdata-com/bigdata-cookbook/blob/main/Risk_Analyzer/README.md).
* API keys are required:
* Option 1: Follow the key setup process described in the [`README.md`](https://github.com/Bigdata-com/bigdata-cookbook/blob/main/Risk_Analyzer/README.md)
* Option 2: Refer to this guide: [How to initialise environment variables](https://docs.bigdata.com/how-to-guides/how_to_prerequisites#initialise-environment-variables)
* ❗ When using this method, you must manually add the OpenAI API key:
```python theme={null}
# OpenAI credentials
OPENAI_API_KEY = ""
```
* 🐳 **Docker Installation**
* [Docker installation](https://github.com/Bigdata-com/bigdata-cookbook/blob/main/Risk_Analyzer/README.md#docker-installation-and-usage) is available for containerized deployment.
* Provides an alternative setup method with containerized deployment, simplifying the environment configuration for those preferring Docker-based solutions.
## Setup and Imports
Below is the Python code required for setting up our environment and importing necessary libraries.
```python [expandable] theme={null}
import os
import pandas as pd
from bigdata_client import Bigdata
from bigdata_client.models.entities import Company
from bigdata_client.models.search import DocumentType
# Bigdata Research Tools imports
from bigdata_research_tools.workflows.risk_analyzer import RiskAnalyzer
# Define output file paths for our results
output_dir = "output"
os.makedirs(output_dir, exist_ok=True)
export_path = f"{output_dir}/risk_analyzer_results.xlsx"
```
## Defining Your Risk Analysis Parameters
To perform a portfolio risk analysis, we need to define several key parameters:
* **Main Theme** (`main_theme`): The risk scenario to analyze (e.g. US Import Tariffs against China)
* **Focus** (`focus`): The analyst focus that provides an expert perspective on the scenario and helps break it down into risk factors
* **Company Universe** (`companies`): The set of companies to screen
* **Control Entities** (`control_entities`): The countries, people, or organizations that characterize the risk scenario
* **Keywords** (`keywords`): The key concepts of the risk scenario
* **Time Period** (`start_date` and `end_date`): The date range over which to run the search
* **Document Type** (`document_type`): Specify which documents to search over (transcripts, filings, news)
* **Fiscal Year** (`fiscal_year`): If the document type is transcripts or filings, fiscal year needs to be specified
* **Sources** (`sources`): Specify set of sources within a document type, for example which news outlets (available via Bigdata API) you wish to search over
* **Model Selection** (`llm_model`): The AI model used for semantic analysis
* **Rerank Threshold** (`rerank_threshold`): By setting this value, you're enabling the cross-encoder which reranks the results and selects those whose relevance is above the percentile you specify (0.7 being the 70th percentile). More information on the re-ranker can be found [here](https://sdk.bigdata.com/en/latest/how_to_guides/rerank_search.html).
* **Export Path** (`export_path`): The path to export the results in an Excel file
```python theme={null}
# Risk Definition
main_theme = 'New US import tariffs against China would impact American companies'
focus = "Provide a detailed taxonomy of risks describing how new American import tariffs against China will impact US companies, their operations and strategy. Cover trade-relations risks, foreign market access risks, supply chain risks, US market sales and revenue risks (including price impacts), and intellectual property risks, provide at least 4 sub-scenarios for each risk factor."
# Company Universe (from Watchlist)
# Get Top US 100 watchlist from Bigdata.com
top100_watchlist_id = "44118802-9104-4265-b97a-2e6d88d74893"
watchlist = bigdata.watchlists.get(top100_watchlist_id)
companies = bigdata.knowledge_graph.get_entities(watchlist.items)
# LLM Specification
llm_model = "openai::gpt-4o-mini"
# Query Configuration
document_type = DocumentType.NEWS
# Enable/Disable Reranker
rerank_threshold = None
# Specify Time Range
start_date = "2025-04-01"
end_date = "2025-06-30"
# Risk Scenario Parameters
countries_at_risk = {'place':['China']}
keywords = ['Tariffs']
```
## Instantiating and Running the Risk Analyzer
The RiskAnalyzer class handles the complete risk analysis workflow:
* **Taxonomy Creation**: Automatically generates a hierarchical tree for US Import Tariffs
* **Content Retrieval**: Searches news for relevant discussions
* **Semantic Labeling**: Uses AI to categorize content into appropriate sub-scenarios
* **Scoring**: Calculates company and industry-level exposure scores
```python theme={null}
# Create the risk analyzer instance
analyzer = RiskAnalyzer(
llm_model=llm_model,
main_theme=main_theme,
companies=companies,
start_date=start_date,
end_date=end_date,
keywords=keywords,
document_type=document_type,
control_entities=countries_at_risk,
sources=None, # Optional filtering by sources
rerank_threshold=rerank_threshold, # Optional reranking threshold
focus=focus # Optional focus to narrow the theme
)
```
## Mindmap a Risk Taxonomy with Bigdata Research Tools
You can leverage Bigdata Research Tools to generate a comprehensive risk taxonomy with an LLM, breaking down a complex risk scenario into well-defined risks and sub-scenarios for more targeted analysis.
```python theme={null}
risk_tree, risk_summaries, terminal_labels = analyzer.create_taxonomy()
risk_tree.visualize()
```
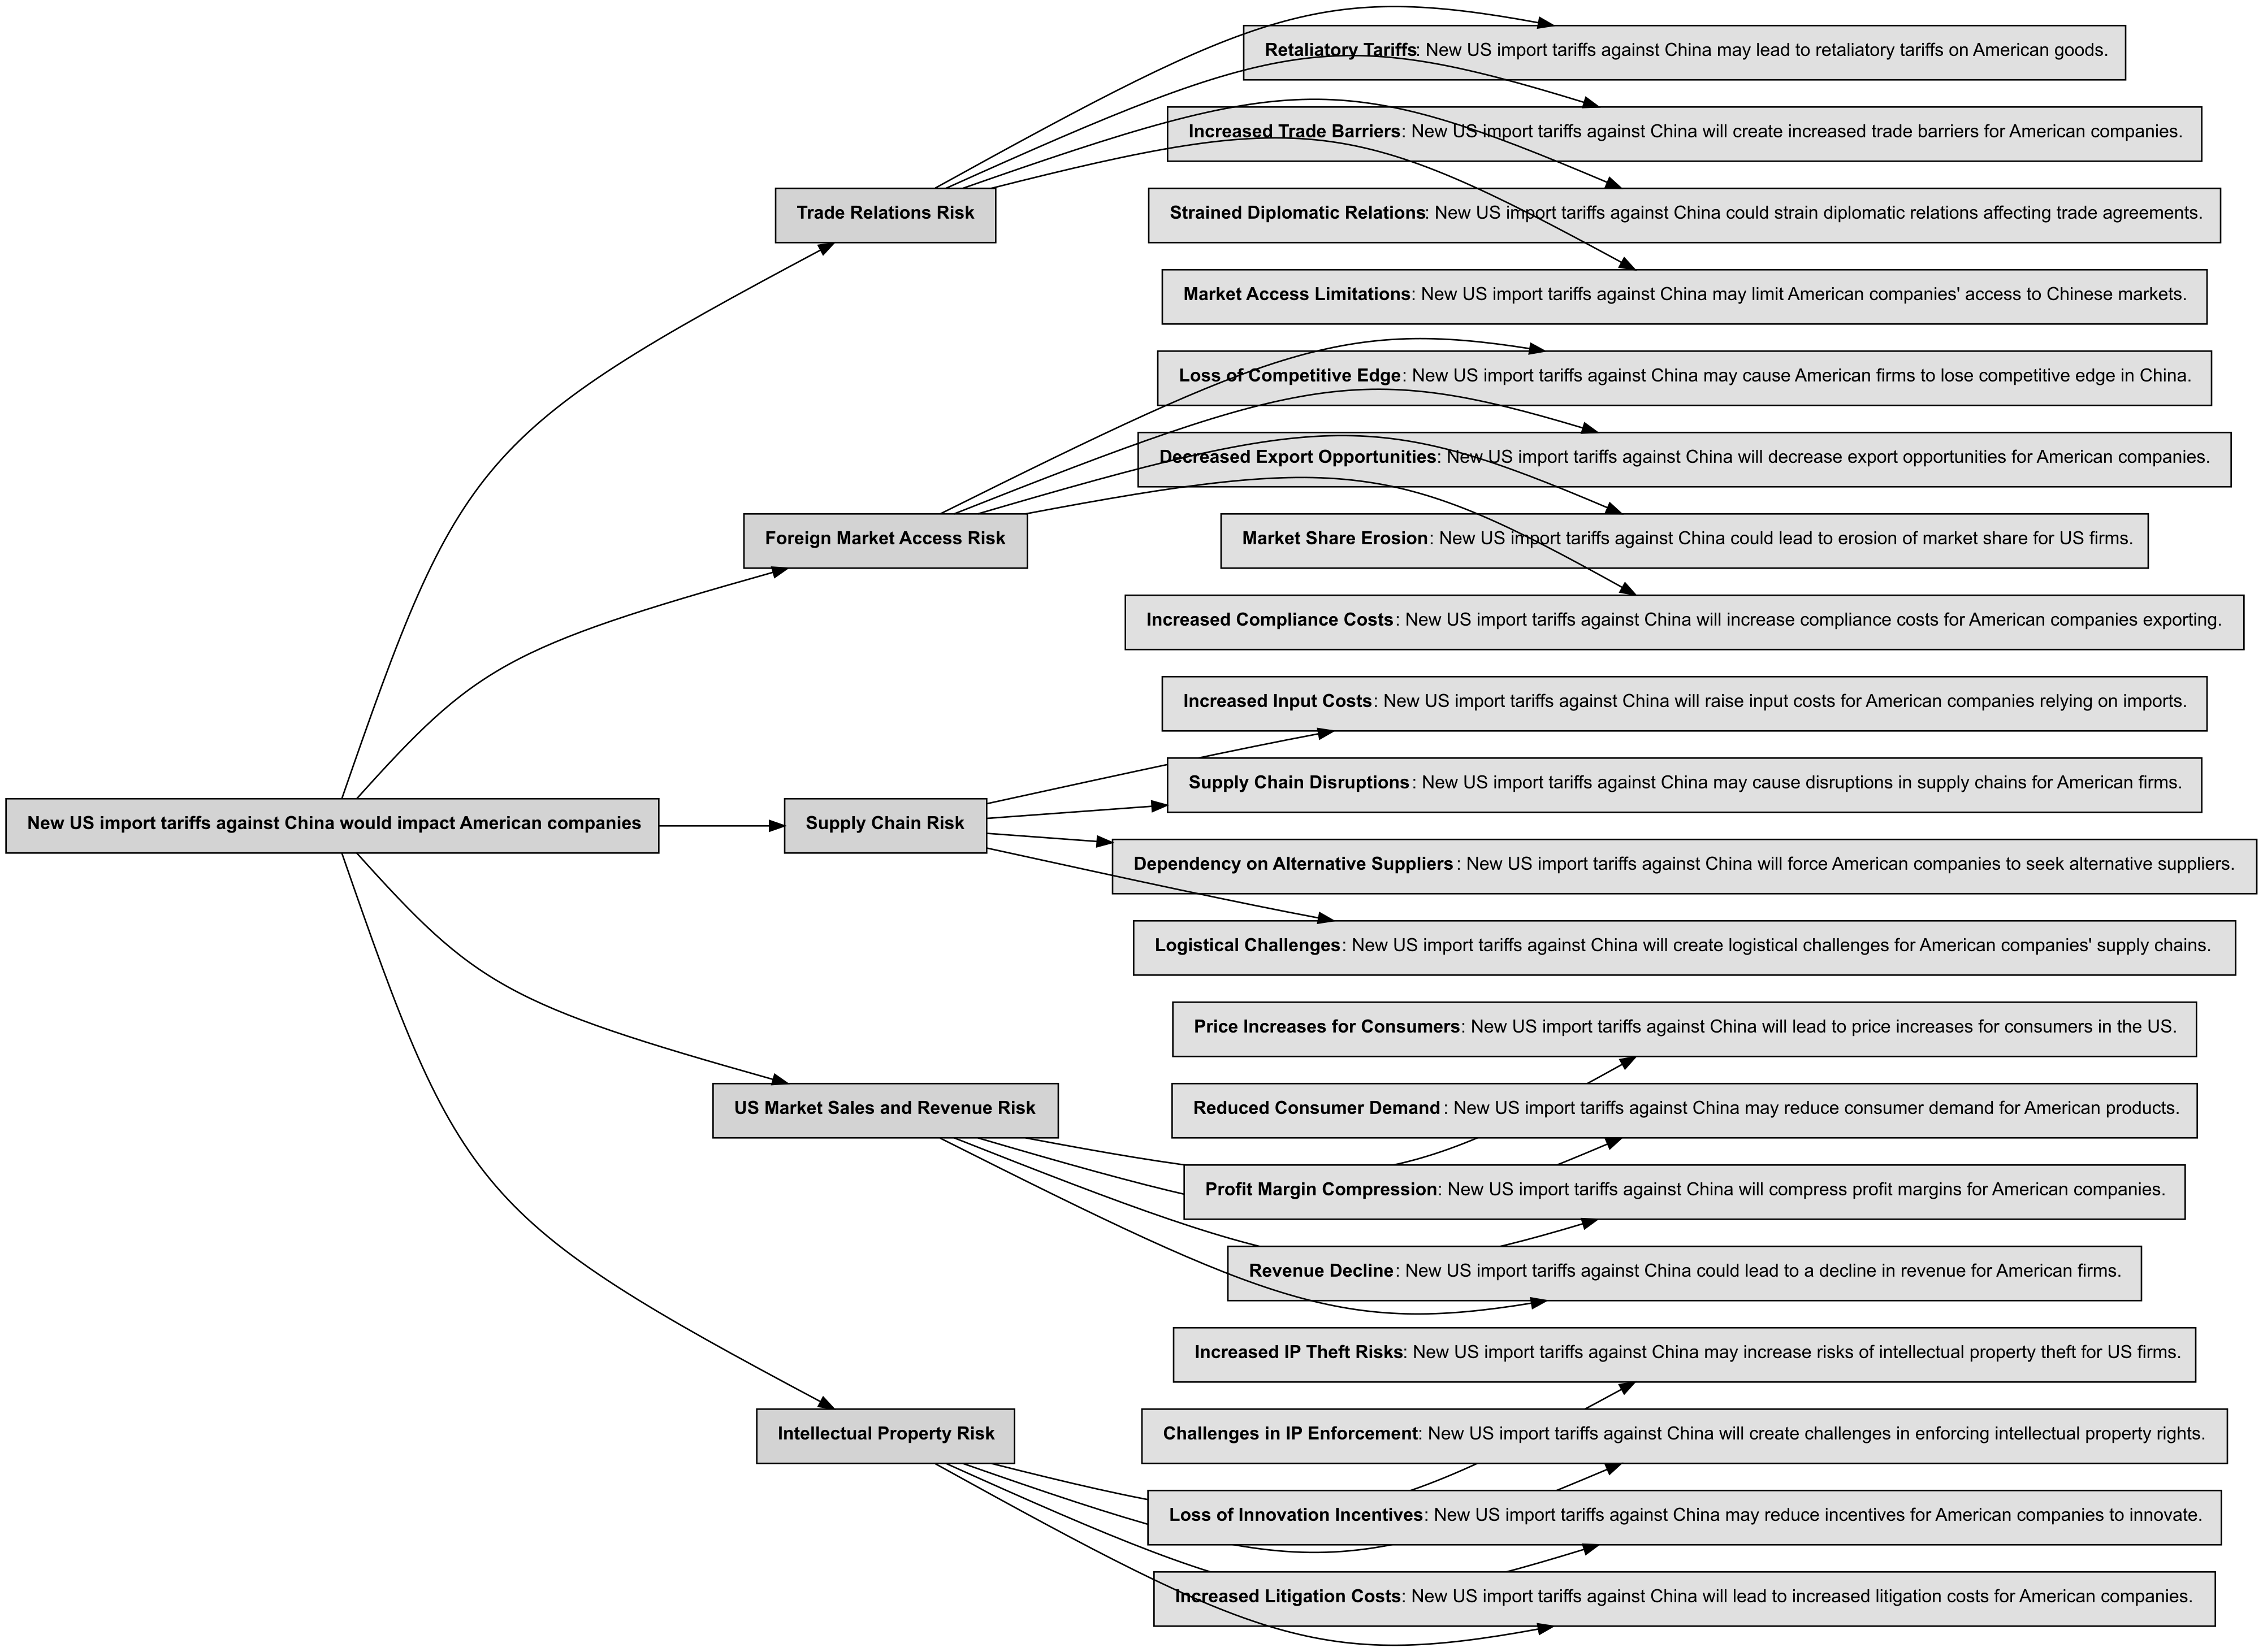 The taxonomy tree includes descriptive sentences that explicitly connect each sub-scenario back to the "US Import Tariffs against China" risk scenario, ensuring all search results remain contextually relevant to our main risk.
## Retrieve Content
With the risk taxonomy and screening parameters, you can leverage the Search functionalities in bigdata-research-tools, built with Bigdata API, to run search at scale on your portfolio against news documents. We need to define 3 more parameters for searching:
* **Frequency** (`freq`): The frequency of the date ranges to search over. Supported values:
* `Y`: Yearly intervals
* `M`: Monthly intervals
* `W`: Weekly intervals
* `D`: Daily intervals.
* **Document Limit** (`document_limit`): The maximum number of documents to return per query to Bigdata API
* **Batch Size** (`batch_size`): The number of entities to include in a single batched query
```python theme={null}
# Query Configuration
document_limit = 100 # Maximum number of documents to retrieve per query
batch_size = 10 # Number of companies to process in each query
frequency = 'M' # Query frequency
df_sentences = analyzer.retrieve_results(
sentences=risk_summaries,
freq=frequency,
document_limit=document_limit,
batch_size=batch_size,
)
df_sentences.head()
```
## Label the Results
Use an LLM to analyze each text chunk and determine its relevance to the sub-scenario. Any chunks which aren't explicitly linking the companies mentioned to the risk sub-scenarios will be filtered out.
```python theme={null}
df, df_labeled = analyzer.label_search_results(
df_sentences=df_sentences,
terminal_labels=terminal_labels,
risk_tree=risk_tree,
additional_prompt_fields=['entity_sector','entity_industry', 'headline']
)
```
## Assess Risk Exposure
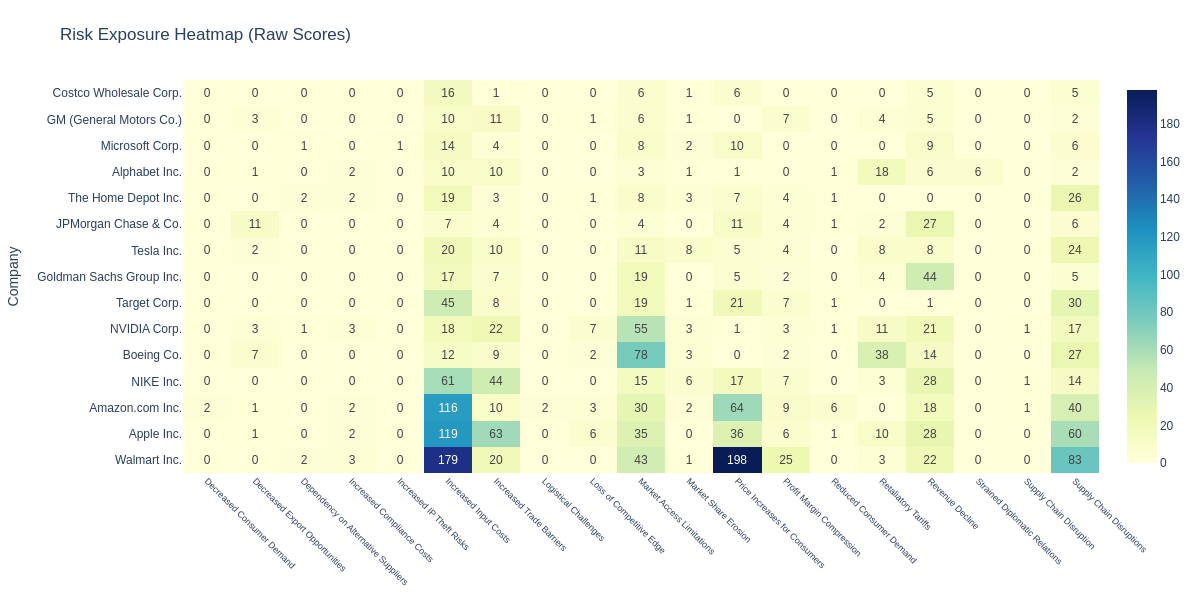
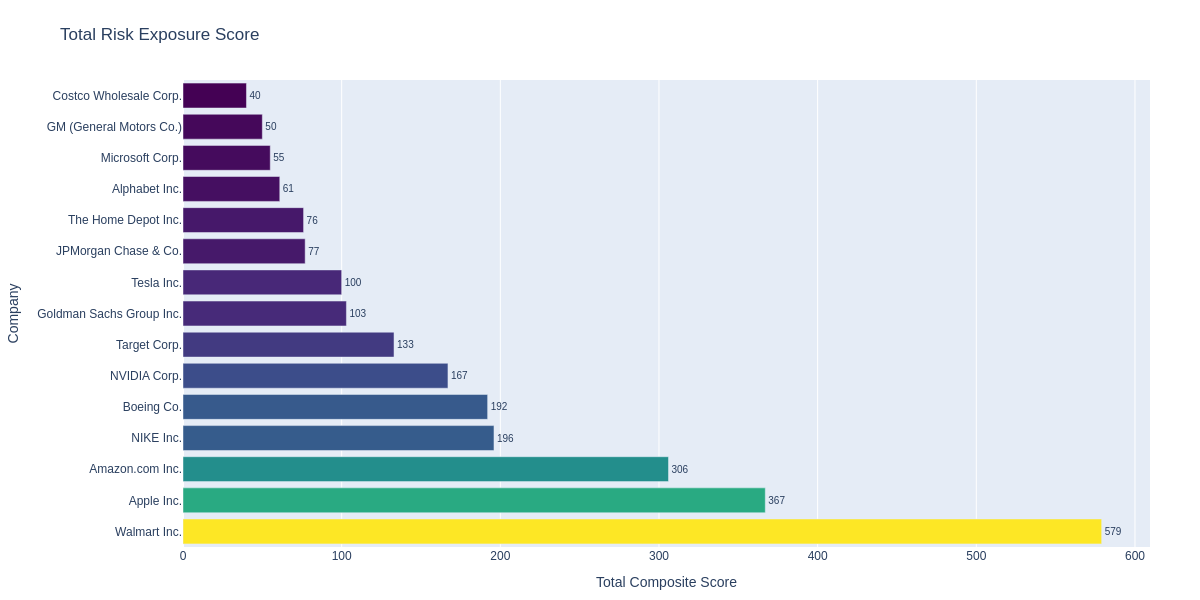
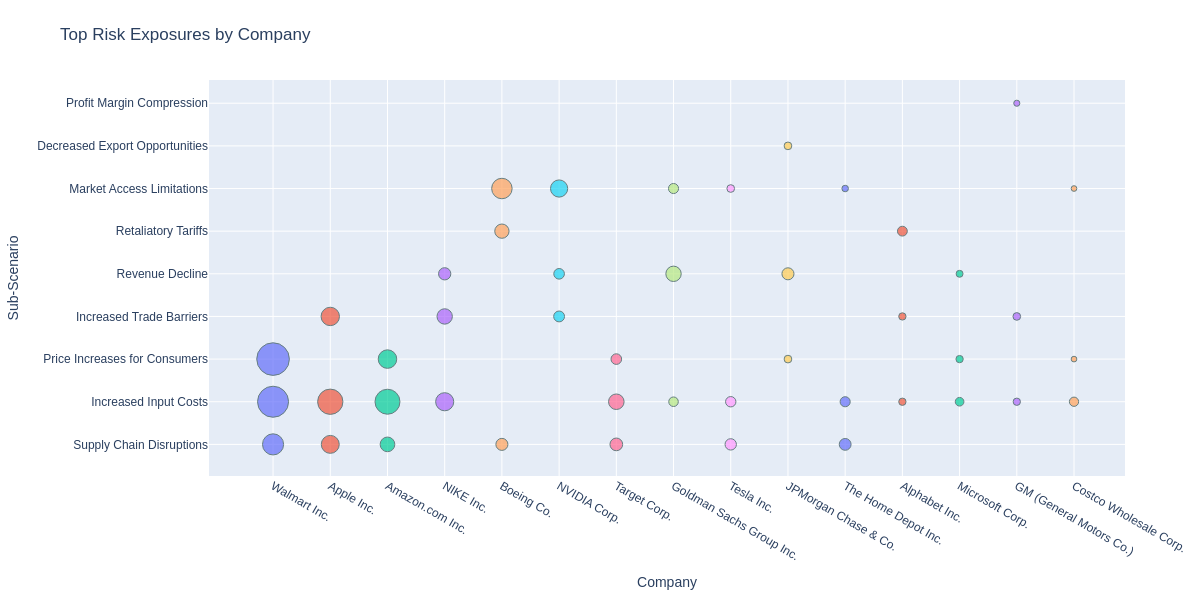
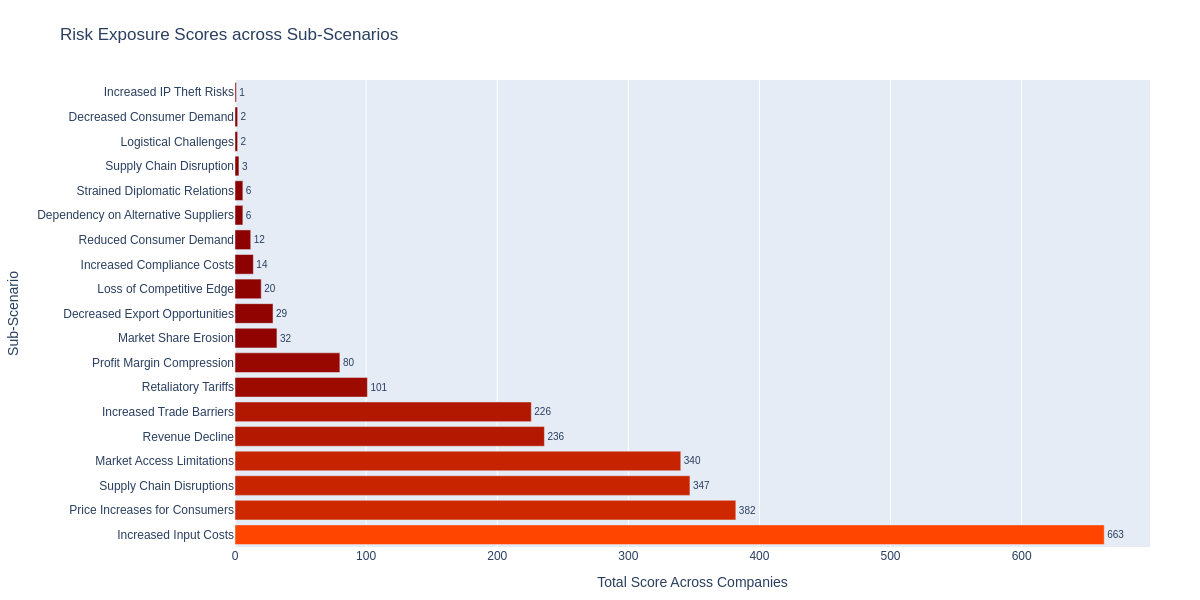
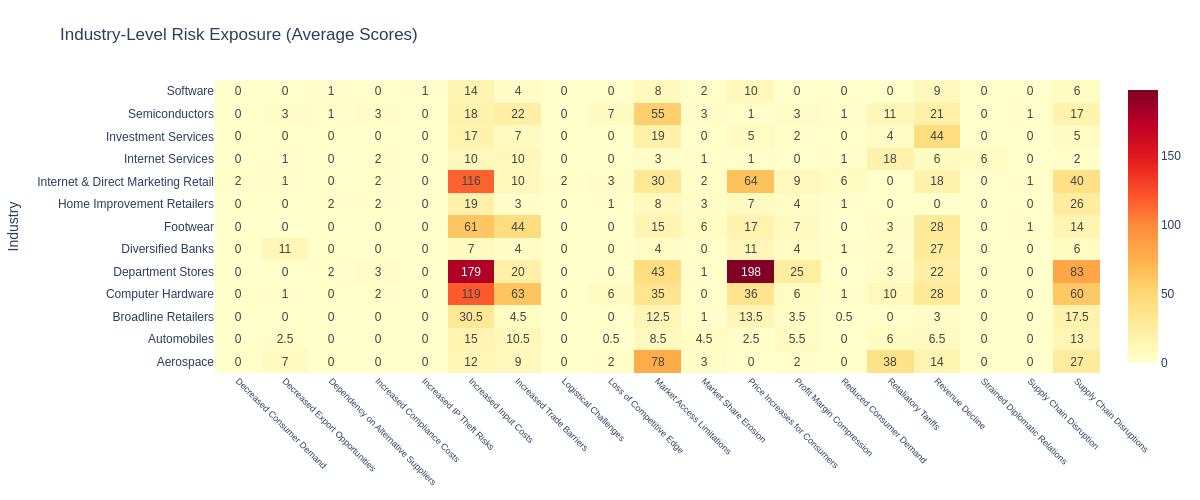
We will look at the most exposed companies to the risks stemming from new U.S. import tariffs against China. The function `generate_results` will calculate the composite score, summing up the scores across the sub-scenarios for each company (`df_company`) or industry (`df_industry`) and add a global motivation statement (`df_motivation`).
```python theme={null}
df_company, df_industry, df_motivation = analyzer.generate_results(df_labeled)
```
Now, let's visualize the results using Plotly to create an interactive dashboard:
```python theme={null}
from bigdata_research_tools.visuals import create_risk_exposure_dashboard
fig, industry_fig = create_risk_exposure_dashboard(df_company, n_companies=15)
fig.show() # Shows the main dashboard
industry_fig.show() # Shows the industry analysis
```
The taxonomy tree includes descriptive sentences that explicitly connect each sub-scenario back to the "US Import Tariffs against China" risk scenario, ensuring all search results remain contextually relevant to our main risk.
## Retrieve Content
With the risk taxonomy and screening parameters, you can leverage the Search functionalities in bigdata-research-tools, built with Bigdata API, to run search at scale on your portfolio against news documents. We need to define 3 more parameters for searching:
* **Frequency** (`freq`): The frequency of the date ranges to search over. Supported values:
* `Y`: Yearly intervals
* `M`: Monthly intervals
* `W`: Weekly intervals
* `D`: Daily intervals.
* **Document Limit** (`document_limit`): The maximum number of documents to return per query to Bigdata API
* **Batch Size** (`batch_size`): The number of entities to include in a single batched query
```python theme={null}
# Query Configuration
document_limit = 100 # Maximum number of documents to retrieve per query
batch_size = 10 # Number of companies to process in each query
frequency = 'M' # Query frequency
df_sentences = analyzer.retrieve_results(
sentences=risk_summaries,
freq=frequency,
document_limit=document_limit,
batch_size=batch_size,
)
df_sentences.head()
```
## Label the Results
Use an LLM to analyze each text chunk and determine its relevance to the sub-scenario. Any chunks which aren't explicitly linking the companies mentioned to the risk sub-scenarios will be filtered out.
```python theme={null}
df, df_labeled = analyzer.label_search_results(
df_sentences=df_sentences,
terminal_labels=terminal_labels,
risk_tree=risk_tree,
additional_prompt_fields=['entity_sector','entity_industry', 'headline']
)
```
## Assess Risk Exposure
We will look at the most exposed companies to the risks stemming from new U.S. import tariffs against China. The function `generate_results` will calculate the composite score, summing up the scores across the sub-scenarios for each company (`df_company`) or industry (`df_industry`) and add a global motivation statement (`df_motivation`).
```python theme={null}
df_company, df_industry, df_motivation = analyzer.generate_results(df_labeled)
```
Now, let's visualize the results using Plotly to create an interactive dashboard:
```python theme={null}
from bigdata_research_tools.visuals import create_risk_exposure_dashboard
fig, industry_fig = create_risk_exposure_dashboard(df_company, n_companies=15)
fig.show() # Shows the main dashboard
industry_fig.show() # Shows the industry analysis
```
 ## Extract Key Insights
The analysis reveals key insights about corporate exposure to U.S. import tariffs against China:
Companies with heavy reliance on Chinese manufacturing and supply chains show the highest exposure scores, indicating vulnerability to cost increases and operational disruptions from new tariff policies.
Technology companies demonstrate significant exposure due to their dependence on Chinese semiconductor and component manufacturing, with potential impacts on both costs and market access.
Consumer-facing companies show exposure through potential margin compression as they navigate between absorbing tariff costs and passing them on to customers.
Companies with diversified supply chains and domestic alternatives show lower risk scores, highlighting the importance of supply chain resilience strategies.
### Industry Risk Patterns
#### High-Risk Sectors
* **Technology and Semiconductors** show the highest average exposure due to supply chain concentration in China
* **Consumer Discretionary** companies face significant margin pressure from potential tariff costs
* **Industrial Manufacturing** with Chinese operations face operational complexity increases
#### Strategic Responses
* Companies with **supply chain diversification** strategies show lower risk scores
* Firms with **domestic manufacturing capabilities** demonstrate greater resilience
* Organizations with **flexible sourcing strategies** appear better positioned to navigate tariff impacts
## Export the Results
Export the data as Excel files for further analysis or to share with the team.
```python theme={null}
analyzer.save_results(
df_labeled,
df_company,
df_industry,
df_motivation,
risk_tree,
export_path=export_path
)
```
## Conclusion
The Risk Analyzer provides a comprehensive framework for identifying and quantifying corporate exposure to specific risk scenarios. By leveraging advanced information retrieval and LLM-powered analysis, this workflow transforms unstructured data into actionable risk intelligence.
Through the automated analysis of U.S. import tariff exposure, you can:
1. **Identify vulnerable companies** - Discover which firms in your portfolio face the highest exposure to tariff-related risks through their operational dependencies and market positions
2. **Compare across industries** - Understand how different sectors are affected by trade policy changes, enabling sector-level hedging and diversification strategies
3. **Monitor risk evolution** - Track how company exposure changes over time as they adapt their strategies or as policy developments unfold
4. **Generate investment insights** - Use risk exposure scores to inform position sizing, hedging decisions, and portfolio construction in volatile geopolitical environments
5. **Support risk management** - Provide quantitative backing for risk committee discussions and regulatory reporting requirements
**Investment Strategy Implications:**
* Consider underweighting companies with high exposure scores in anticipation of tariff implementation
* Use sector-level exposure analysis to guide allocation decisions and hedging strategies
* Monitor risk score changes to identify companies successfully adapting to trade policy challenges
Whether you're conducting portfolio stress testing, building risk-aware investment strategies, or assessing geopolitical exposure across your holdings, the Risk Analyzer automates the research process while maintaining the depth and rigor required for professional risk analysis. The standardized scoring methodology ensures consistent evaluation across companies, sectors, and time periods, making it an invaluable tool for systematic risk assessment in an increasingly complex global environment.
## Extract Key Insights
The analysis reveals key insights about corporate exposure to U.S. import tariffs against China:
Companies with heavy reliance on Chinese manufacturing and supply chains show the highest exposure scores, indicating vulnerability to cost increases and operational disruptions from new tariff policies.
Technology companies demonstrate significant exposure due to their dependence on Chinese semiconductor and component manufacturing, with potential impacts on both costs and market access.
Consumer-facing companies show exposure through potential margin compression as they navigate between absorbing tariff costs and passing them on to customers.
Companies with diversified supply chains and domestic alternatives show lower risk scores, highlighting the importance of supply chain resilience strategies.
### Industry Risk Patterns
#### High-Risk Sectors
* **Technology and Semiconductors** show the highest average exposure due to supply chain concentration in China
* **Consumer Discretionary** companies face significant margin pressure from potential tariff costs
* **Industrial Manufacturing** with Chinese operations face operational complexity increases
#### Strategic Responses
* Companies with **supply chain diversification** strategies show lower risk scores
* Firms with **domestic manufacturing capabilities** demonstrate greater resilience
* Organizations with **flexible sourcing strategies** appear better positioned to navigate tariff impacts
## Export the Results
Export the data as Excel files for further analysis or to share with the team.
```python theme={null}
analyzer.save_results(
df_labeled,
df_company,
df_industry,
df_motivation,
risk_tree,
export_path=export_path
)
```
## Conclusion
The Risk Analyzer provides a comprehensive framework for identifying and quantifying corporate exposure to specific risk scenarios. By leveraging advanced information retrieval and LLM-powered analysis, this workflow transforms unstructured data into actionable risk intelligence.
Through the automated analysis of U.S. import tariff exposure, you can:
1. **Identify vulnerable companies** - Discover which firms in your portfolio face the highest exposure to tariff-related risks through their operational dependencies and market positions
2. **Compare across industries** - Understand how different sectors are affected by trade policy changes, enabling sector-level hedging and diversification strategies
3. **Monitor risk evolution** - Track how company exposure changes over time as they adapt their strategies or as policy developments unfold
4. **Generate investment insights** - Use risk exposure scores to inform position sizing, hedging decisions, and portfolio construction in volatile geopolitical environments
5. **Support risk management** - Provide quantitative backing for risk committee discussions and regulatory reporting requirements
**Investment Strategy Implications:**
* Consider underweighting companies with high exposure scores in anticipation of tariff implementation
* Use sector-level exposure analysis to guide allocation decisions and hedging strategies
* Monitor risk score changes to identify companies successfully adapting to trade policy challenges
Whether you're conducting portfolio stress testing, building risk-aware investment strategies, or assessing geopolitical exposure across your holdings, the Risk Analyzer automates the research process while maintaining the depth and rigor required for professional risk analysis. The standardized scoring methodology ensures consistent evaluation across companies, sectors, and time periods, making it an invaluable tool for systematic risk assessment in an increasingly complex global environment.