> ## Documentation Index
> Fetch the complete documentation index at: https://docs.bigdata.com/llms.txt
> Use this file to discover all available pages before exploring further.
# Thematic Screeners
> Identify Companies Aligned with Investment Themes
## Why It Matters
Thematic investing requires systematic identification of companies aligned with structural trends, but manually tracking exposure across thousands of documents is inefficient and inconsistent. As mega-trends like AI and decarbonization reshape markets, investors need scalable ways to quantify which companies are genuinely positioned to benefit.
## What It Does
The `ThematicScreener` class in the `bigdata-research-tools` package helps solve this problem. Designed for analysts, PMs, and strategists managing thematic portfolios or scouting new ideas, it systematically connects companies to investment themes using unstructured data from news, earnings calls, and filings.
## How It Works
The `ThematicScreener` combines **LLM-powered theme taxonomies**, **semantic content retrieval**, and **structured scoring methodologies** to deliver:
* **Automated theme breakdown** into specific, measurable sub-categories
* **Systematic positioning analysis** to identify how companies align with key themes
* **Cross-sector exposure comparison** enabling portfolio-level thematic assessment
* **Qualitative-to-quantitative transformation** that turns narrative signals into structured, actionable insights
## A Real-World Use Case
This cookbook walks through a full workflow, from defining a theme to quantifying company exposure, using "Supply Chain Reshaping" analysis across Top US 100 companies as a practical example.
**Ready to get started? Let's dive in!**


## Prerequisites
To run the Thematic Screener workflow, you can choose between three options:
* ▶️ **Colab cookbook**
* Use this if you prefer running the workflow in a cloud environment.
* Follow the instructions written directly inside the cookbook.
* API keys must be configured as described within the Colab file itself.
* 💻 **GitHub cookbook**
* Use this if you prefer working locally or in a custom environment.
* Follow the setup and execution instructions in the [`README.md`](https://github.com/Bigdata-com/bigdata-cookbook/blob/main/Thematic_Screener/README.md).
* API keys are required:
* Option 1: Follow the key setup process described in the [`README.md`](https://github.com/Bigdata-com/bigdata-cookbook/blob/main/Thematic_Screener/README.md)
* Option 2: Refer to this guide: [How to initialise environment variables](https://docs.bigdata.com/how-to-guides/how_to_prerequisites#initialise-environment-variables)
* ❗ When using this method, you must manually add the OpenAI API key:
```python theme={null}
# OpenAI credentials
OPENAI_API_KEY = ""
```
* 🐳 **Docker Installation**
* [Docker installation](https://github.com/Bigdata-com/bigdata-cookbook/blob/main/Thematic_Screener/README.md#docker-installation-and-usage) is available for containerized deployment.
* Provides an alternative setup method with containerized deployment, simplifying the environment configuration for those preferring Docker-based solutions.
## Setup and Imports
Below is the Python code required for setting up our environment and importing necessary libraries.
```python [expandable] theme={null}
import os
from logging import Logger, getLogger
from typing import Dict, List, Optional
import matplotlib.gridspec as gridspec
import matplotlib.pyplot as plt
from matplotlib.colors import LinearSegmentedColormap
import numpy as np
import pandas as pd
from pandas import DataFrame, merge
import plotly
import plotly.io as pio
import seaborn as sns
pio.renderers.default = 'colab' # Change this if you're running in a different environment
plotly.offline.init_notebook_mode()
from bigdata_client import Bigdata
from bigdata_client.models.entities import Company
from bigdata_client.models.search import DocumentType
from bigdata_research_tools.labeler.screener_labeler import ScreenerLabeler
from bigdata_research_tools.search.screener_search import search_by_companies
from bigdata_research_tools.themes import (
SourceType,
generate_theme_tree,
stringify_label_summaries,
)
from bigdata_research_tools.screeners import ExecutiveNarrativeFactor
from bigdata_research_tools.screeners.utils import get_scored_df
# For Excel functionality
from bigdata_research_tools.excel import ExcelManager
# Define output file paths for our results
output_dir = "output"
os.makedirs(output_dir, exist_ok=True)
export_path = f"{output_dir}/thematic_screener_results.xlsx"
```
## Defining your Screening Parameters
* **Main Theme** (`main_theme`): The central concept to explore
* **Company Universe** (`companies`): The set of companies to screen
* **Time Period** (`start_date` and `end_date`): The date range over which to run the search
* **Document Type** (`document_type`): Specify which documents to search over (transcripts, filings, news)
* **Sources** (`sources`): Specify set of sources within a document type, for example which news outlets (available via Bigdata API) you wish to search over
* **Fiscal Year** (`fiscal_year`): If the document type is transcripts or filings, fiscal year needs to be specified
* **Model Selection** (`llm_model`): The LLM model used to mindmap the theme and label the search result chunks
* **Rerank Threshold** (`rerank_threshold`): By setting this value, you're enabling the cross-encoder which reranks the results and selects those whose relevance is above the percentile you specify (0.7 being the 70th percentile). More information on the re-ranker can be found [here](https://sdk.bigdata.com/en/latest/how_to_guides/rerank_search.html).
* **Focus** (`focus`): Specify a focus within the main theme. This will then be used in building the LLM generated mindmapper
```python theme={null}
# ===== Theme Definition =====
main_theme = "Supply Chain Reshaping"
# ===== Company Universe (from Watchlist) =====
# Get Top Us 100 watchlist from Bigdata.com
top100_watchlist_id = "44118802-9104-4265-b97a-2e6d88d74893"
watchlist = bigdata.watchlists.get(top100_watchlist_id)
companies = bigdata.knowledge_graph.get_entities(watchlist.items)
# ===== LLM Specification =====
llm_model = "openai::gpt-4o-mini"
# ===== Transcript Configuration =====
document_type = DocumentType.TRANSCRIPTS
fiscal_year = 2024
# ===== Enable/Disable Reranker =====
rerank_threshold = None
# ===== Specify Time Range =====
start_date = "2024-03-01"
end_date = "2025-03-01"
```
## Mindmap a Theme Taxonomy with Bigdata Research Tools
You can leverage Bigdata Research Tools to generate a comprehensive theme taxonomy with an LLM, breaking down a megatrend into smaller, well-defined concepts for more targeted analysis.
```python theme={null}
theme_tree = generate_theme_tree(
main_theme=main_theme,
dataset=SourceType.CORPORATE_DOCS,
)
theme_tree.visualize()
```
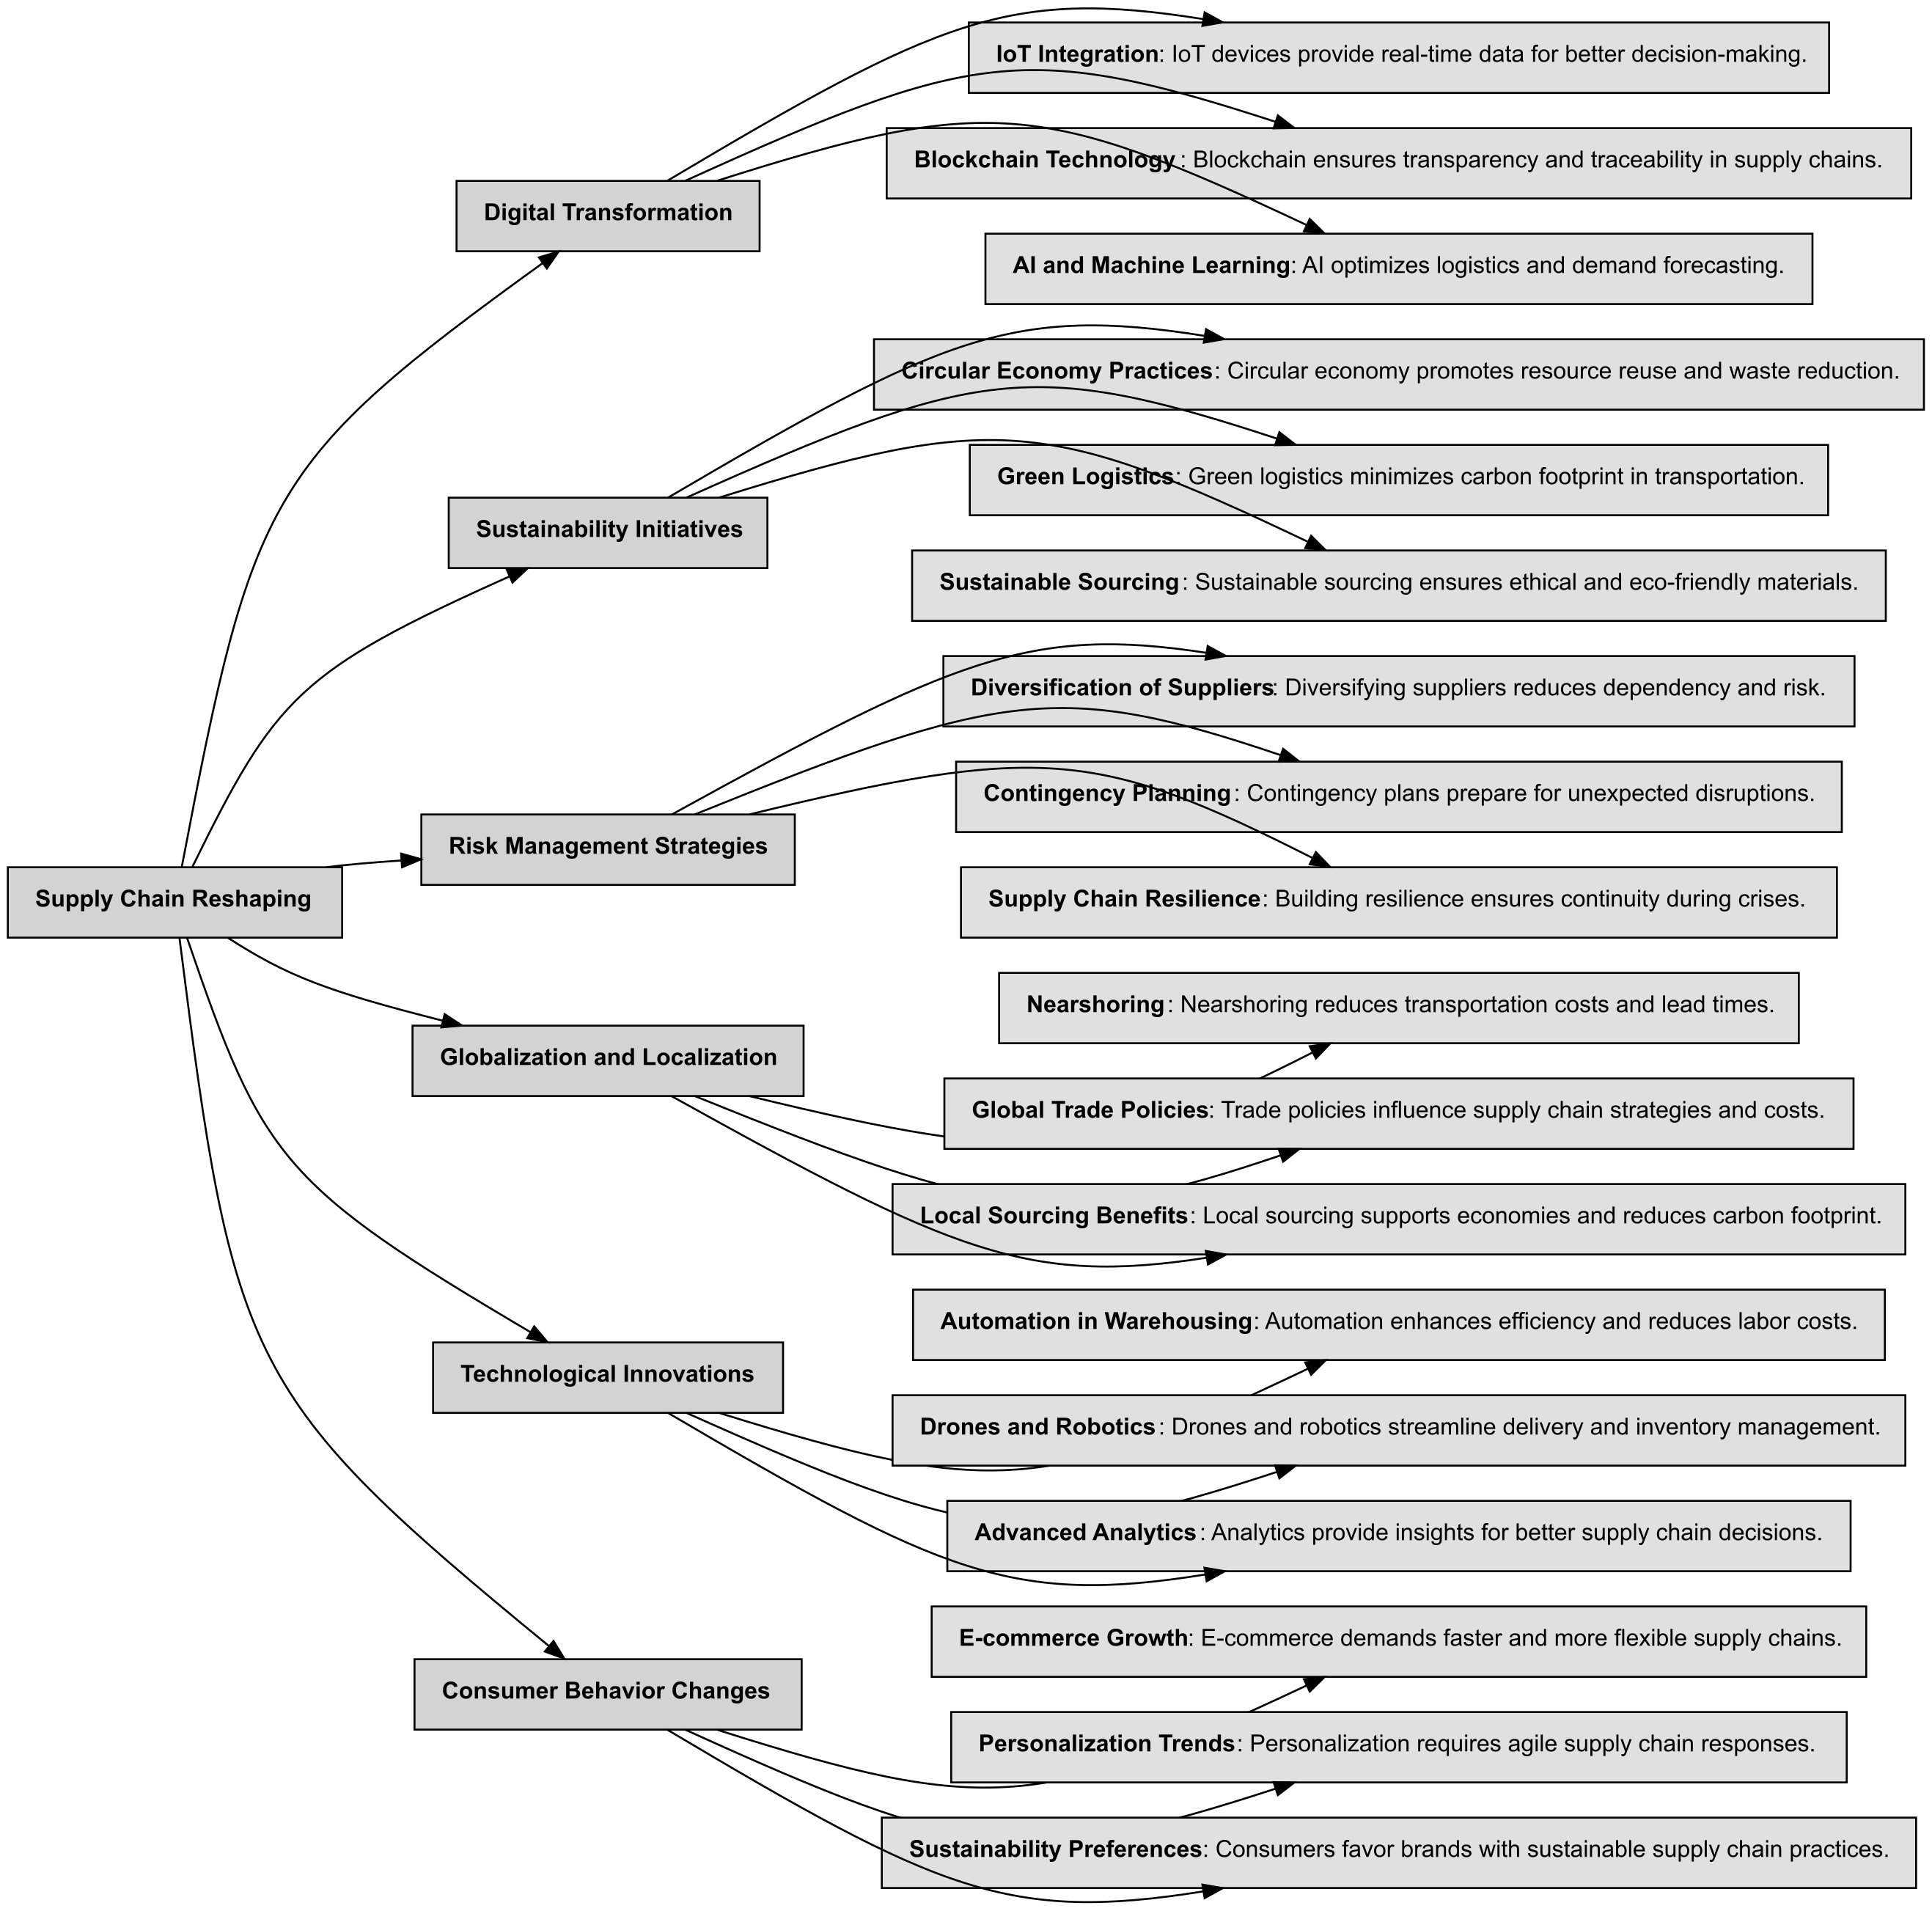 The taxonomy tree includes descriptive sentences that explicitly connect each sub-theme back to the "Supply Chain Reshaping" main theme, ensuring all search results remain contextually relevant to our central trend.
```python theme={null}
node_summaries = theme_tree.get_summaries()
node_summaries
```
## Retrieve Content
With the theme taxonomy and screening parameters, you can leverage the Bigdata API to run a search on company transcripts. We need to define 3 more parameters for searching:
* **Frequency** (`freq`): The frequency of the date ranges to search over. Supported values:
* `Y`: Yearly intervals.
* `M`: Monthly intervals.
* `W`: Weekly intervals.
* `D`: Daily intervals. Defaults to `3M`.
* **Document Limit** (`document_limit`): The maximum number of documents to return per query to Bigdata API.
* **Batch Size** (`batch_size`): The number of entities to include in a single batched query.
```python theme={null}
freq = "6M"
document_limit = 100
batch_size = 10
df_sentences = search_by_companies(
companies=companies,
sentences=node_summaries,
start_date=start_date,
end_date=end_date,
scope=document_type,
fiscal_year=fiscal_year,
rerank_threshold=rerank_threshold,
freq=freq,
document_limit=document_limit,
batch_size=batch_size,
)
df_sentences.head(5)
```
**DataFrame Summary:** 5 rows × 16 columns
| # | Timestamp UTC | RP Document ID | Sentence ID | Headline | Entity Name | Text | Masked Text |
| - | ------------------------- | -------------------------------- | ---------------------------------- | ------------------------------------------------------------- | ----------- | ---------------------------------------------------------------------------------------------------------------------------------------------------------------------------------------------------------------------------------------------------------------------------------------------------------------------------------------------------------------------------------------------------------------------------------------------------------------------------------------------------------------------------------------------------------------------------------------------------------------------------------------------------------------------------------------------------------------------------------------------------------------------------------------------------------------------------------------------------- | ------------------------------------------------------------------------------------------------------------------------------------------------------------------------------------------------------------------------------------------------------------------------------------------------------------------------------------------------------------------------------------------------------------------------------------------------------------------------------------------------------------------------------------------------------------------------------------------------------------------------------------------------------------------------------------------------------------------------------------------------------------------------------------------------------------------------------------------------------------------------------------------------------------------------------------- |
| 0 | 2024-03-21 09:00:00+00:00 | 381E04DC8007FBF551D807540B70FAEA | 381E04DC8007FBF551D807540B70FAEA-0 | ABB: 2024 Annual General Meeting on Mar 21, 2024 - Transcript | ABB Ltd. | But the climate crisis also opens up a plethora of opportunities for APB. After all, we have the innovative technologies, products and solutions that make it possible to stem the tide of climate change. Robotics and automation also play a crucial role here as they enable enterprises to utilize precious resources more economically. This starts with raw materials and continues all the way to recycling. ABB's digitalization and automation solutions also help our customers work and manufacture their products more effectively and efficiently to support the critical transition to the circular economy and ultimately improve their competitive edge. | But the climate crisis also opens up a plethora of opportunities for APB. After all, Target Company have the innovative technologies, products and solutions that make it possible to stem the tide of climate change. Robotics and automation also play a crucial role here as they enable enterprises to utilize precious resources more economically. This starts with raw materials and continues all the way to recycling. Target Company's digitalization and automation solutions also help Target Company customers work and manufacture their products more effectively and efficiently to support the critical transition to the circular economy and ultimately improve their competitive edge. |
| 1 | 2024-03-21 09:00:00+00:00 | 381E04DC8007FBF551D807540B70FAEA | 381E04DC8007FBF551D807540B70FAEA-2 | ABB: 2024 Annual General Meeting on Mar 21, 2024 - Transcript | ABB Ltd. | The significance of AI extends beyond merely enhancing work processes or executing tasks with greater speed, precision and autonomy through machine vision. Generative AI is democratizing access to automation and robotics, not just for technologists or software engineers, but for everyone. As long as people think clearly and logically, they can instruct the system on their desired outcomes, thereby unlocking the full potential of AI for every manager and worker alike. Clearly, all of this necessitates the establishment of clear standards to ensure that both we and our customers can leverage the power of AI safely and responsibly. And I want to state unequivocally that our society must enact regulations governing the use of AI. | The significance of AI extends beyond merely enhancing work processes or executing tasks with greater speed, precision and autonomy through machine vision. Generative AI is democratizing access to automation and robotics, not just for technologists or software engineers, but for everyone. As long as people think clearly and logically, they can instruct the system on their desired outcomes, thereby unlocking the full potential of AI for every manager and worker alike. Clearly, all of this necessitates the establishment of clear standards to ensure that both Target Company and Target Company customers can leverage the power of AI safely and responsibly. And I want to state unequivocally that Target Company society must enact regulations governing the use of AI. |
| 2 | 2024-03-21 09:00:00+00:00 | 381E04DC8007FBF551D807540B70FAEA | 381E04DC8007FBF551D807540B70FAEA-3 | ABB: 2024 Annual General Meeting on Mar 21, 2024 - Transcript | ABB Ltd. | The situation in the Middle East is deeply concerning. Vital shipping routes have been disrupted and geopolitical tensions show no sign of easing. In short, the macroeconomic and political environment is volatile. It was in the last year and it is in this year and it is profoundly uncertain. In times like these, it is essential for businesses to ensure that they are well positioned strategically Rather than allowing uncertainty to undermine our ambitions, companies must become resilient to crises and well as more agile and sustainable. | The situation in the Middle East is deeply concerning. Vital shipping routes have been disrupted and geopolitical tensions show no sign of easing. In short, the macroeconomic and political environment is volatile. It was in the last year and it is in this year and it is profoundly uncertain. In times like these, it is essential for businesses to ensure that they are well positioned strategically Rather than allowing uncertainty to undermine Target Company ambitions, companies must become resilient to crises and well as more agile and sustainable. |
| 3 | 2024-03-21 09:00:00+00:00 | 381E04DC8007FBF551D807540B70FAEA | 381E04DC8007FBF551D807540B70FAEA-1 | ABB: 2024 Annual General Meeting on Mar 21, 2024 - Transcript | ABB Ltd. | The ABB way also plays a vital role here, for example, with our local for local strategy. ABB may be a global corporation, but we still need to reduce our dependencies on certain geographies. This is why in the USA, we now produce around 75% of products there. In China, it's approximately 85 percent and in Europe, about 95%. The result is more flexibility and resilience. And it's no different with what is likely to be the greatest challenge facing humanity today, climate change. Let me make one thing abundantly clear. The energy transition, the expansion of renewable energy sources and decarbonization of our economy are not negotiable. We must tackle climate change. We owe it to ourselves and to future generations. | The Target Company way also plays a vital role here, for example, with Target Company local for local strategy. Target Company may be a global corporation, but Target Company still need to reduce Target Company dependencies on certain geographies. This is why in the USA, Target Company now produce around 75% of products there. In China, it's approximately 85 percent and in Europe, about 95%. The result is more flexibility and resilience. And it's no different with what is likely to be the greatest challenge facing humanity today, climate change. Let me make one thing abundantly clear. The energy transition, the expansion of renewable energy sources and decarbonization of Target Company economy are not negotiable. Target Company must tackle climate change. Target Company owe it to ourselves and to future generations. |
| 4 | 2024-03-21 09:00:00+00:00 | 381E04DC8007FBF551D807540B70FAEA | 381E04DC8007FBF551D807540B70FAEA-1 | ABB: 2024 Annual General Meeting on Mar 21, 2024 - Transcript | ABB Ltd. | Distinguished shareholders, Bjorn did a fantastic job for ABB. Please give him a round of applause. I'm also proud that we've found a competent successor from our own ranks in Morten Virod as he's actually here as well in one of the first rows. As you know, Bjorn will be handing over the management of the company to Morten in the course of the year. Morten is very familiar with ABB and has a deep understanding of our decentralized business model, which he will continue to strengthen. This will allow us to guarantee continuity and ensure that ABB can continue on its successful trajectory. All the best, and I look forward to working with you, Morton. I spoke earlier about the need for us to be resilient in the face of crises. This also means maintaining short supply chains and direct proximity to our customers. | Distinguished shareholders, Bjorn did a fantastic job for Target Company. Please give him a round of applause. I'm also proud that Target Company've found a competent successor from Target Company own ranks in Morten Virod as he's actually here as well in one of the first rows. As you know, Bjorn will be handing over the management of Target Company to Morten in the course of the year. Morten is very familiar with Target Company and has a deep understanding of Target Company decentralized business model, which he will continue to strengthen. This will allow us to guarantee continuity and ensure that Target Company can continue on its successful trajectory. All the best, and I look forward to working with you, Morton. I spoke earlier about the need for us to be resilient in the face of crises. This also means maintaining short supply chains and direct proximity to Target Company customers. |
**Additional Columns:** Masked Text, RP Entity ID, Entity Sector, Entity Industry, Entity Country, Entity Ticker, Other Entities, Entities, Other Entities Map
## Label the Results
Use an LLM to analyze each text chunk and determine its relevance to the sub-themes. Any chunks which aren't explicitly linked to supply chain reshaping will be filtered out.
```python theme={null}
labeler = ScreenerLabeler(llm_model=llm_model)
df_labels = labeler.get_labels(
main_theme=main_theme,
labels=list(theme_tree.get_terminal_label_summaries().keys()),
texts=df_sentences["masked_text"].tolist(),
)
# Merge and process results
df = merge(df_sentences, df_labels, left_index=True, right_index=True)
df = labeler.post_process_dataframe(df)
```
## Assess Thematic Exposure
We'll look at the top 10 most exposed companies to supply chain reshaping. The function `get_scored_df` will calculate the composite thematic score, summing up the scores across the sub-themes for each company (`df_company`) or industry (`df_industry`).
```python theme={null}
df_company, df_industry = DataFrame(), DataFrame()
df_company = get_scored_df(
df, index_columns=["Company", "Ticker", "Industry"], pivot_column="Theme"
)
df_industry = get_scored_df(
df, index_columns=["Industry"], pivot_column="Theme"
)
```
Now, let's visualize the results using Plotly to create an interactive dashboard:
```python [expandable] theme={null}
import pandas as pd
import numpy as np
import plotly.graph_objects as go
from plotly.subplots import make_subplots
import plotly.io as pio
import plotly.offline
pio.renderers.default = 'colab'
plotly.offline.init_notebook_mode()
def create_thematic_exposure_dashboard(df_company, n_companies=10):
"""
Creates five separate figures for analyzing thematic exposure of companies.
Parameters:
-----------
df_company : pandas.DataFrame
DataFrame containing company data with columns for 'Company', 'Industry',
'Composite Score', and multiple thematic exposure columns.
n_companies : int, default=10
Number of companies to include in the analysis.
Returns:
--------
tuple
A tuple containing five Plotly figures:
- fig_heatmap: Company-theme exposure heatmap
- fig_total_scores: Total composite scores bar chart
- fig_scatter_themes: Top themes scatter plot by company
- fig_bar_themes: Thematic scores horizontal bar chart
- fig_industry_heatmap: Industry-level analysis heatmap
"""
# Select top n companies and reset index
df = df_company[:n_companies].reset_index(drop=True).copy()
# Extract theme column names (all columns between 'Industry' and 'Composite Score')
theme_columns = list(df.iloc[:, 3:-1].columns)
# Create all figures
fig_heatmap = create_company_theme_heatmap(df, theme_columns)
fig_total_scores = create_company_scores_bar_chart(df)
fig_scatter_themes = create_top_themes_scatter_plot(df, theme_columns)
fig_bar_themes = create_themes_summary_bar_chart(df, theme_columns)
fig_industry_heatmap = create_industry_analysis_heatmap(df, theme_columns)
return fig_heatmap, fig_total_scores, fig_scatter_themes, fig_bar_themes, fig_industry_heatmap
def create_company_theme_heatmap(df, theme_columns):
"""
Creates a heatmap showing thematic exposure scores for each company.
Parameters:
-----------
df : pandas.DataFrame
The data frame containing company and theme data
theme_columns : list
List of column names representing thematic categories
Returns:
--------
plotly.graph_objects.Figure
Heatmap figure with color scale
"""
fig = go.Figure()
heatmap_z = df[theme_columns].values
heatmap_x = theme_columns
heatmap_y = df['Company'].tolist()
fig.add_trace(
go.Heatmap(
z=heatmap_z,
x=heatmap_x,
y=heatmap_y,
colorscale='YlGnBu',
text=heatmap_z.astype(int),
texttemplate="%{text}",
showscale=True,
)
)
fig.update_layout(
title='Company Thematic Exposure Heatmap (Raw Scores)',
height=600,
width=1200,
margin=dict(l=60, r=50, t=80, b=50),
xaxis=dict(tickangle=45, tickfont=dict(size=9)),
yaxis=dict(title="Company")
)
return fig
def create_company_scores_bar_chart(df):
"""
Creates a horizontal bar chart showing total composite scores for companies.
Parameters:
-----------
df : pandas.DataFrame
The data frame containing company scores
Returns:
--------
plotly.graph_objects.Figure
Bar chart figure showing total composite scores
"""
fig = go.Figure()
companies = df['Company'].tolist()
total_scores = df['Composite Score'].tolist()
# Sort by score for better visualization (highest first)
sorted_indices = np.argsort(total_scores)[::-1]
sorted_companies = [companies[i] for i in sorted_indices]
sorted_scores = [total_scores[i] for i in sorted_indices]
fig.add_trace(
go.Bar(
y=sorted_companies,
x=sorted_scores,
orientation='h',
marker=dict(
color=sorted_scores,
colorscale='Viridis',
showscale=False
),
text=sorted_scores,
textposition='outside',
textfont=dict(size=10),
)
)
fig.update_layout(
title='Company Total Composite Scores',
height=600,
width=1200,
margin=dict(l=60, r=50, t=80, b=50),
xaxis=dict(title="Total Composite Score"),
yaxis=dict(title="Company")
)
return fig
def create_top_themes_scatter_plot(df, theme_columns):
"""
Creates a scatter plot showing the top 3 thematic exposures for each company.
Parameters:
-----------
df : pandas.DataFrame
The data frame containing company and theme data
theme_columns : list
List of column names representing thematic categories
Returns:
--------
plotly.graph_objects.Figure
Scatter plot showing top themes by company
"""
fig = go.Figure()
max_score = df[theme_columns].values.max()
companies_unique = df['Company'].unique()
for i, company in enumerate(companies_unique):
company_data = df[df['Company'] == company]
if len(company_data) == 0:
continue
company_row = company_data.iloc[0]
company_scores = company_row[theme_columns].values
top_indices = np.argsort(company_scores)[-3:]
x_values = []
y_values = []
sizes = []
hover_texts = []
for idx in top_indices:
if company_scores[idx] > 0:
theme = theme_columns[idx]
score = company_scores[idx]
size = (score / max_score) * 80
x_values.append(company)
y_values.append(theme)
sizes.append(size)
hover_texts.append(f"{company}
The taxonomy tree includes descriptive sentences that explicitly connect each sub-theme back to the "Supply Chain Reshaping" main theme, ensuring all search results remain contextually relevant to our central trend.
```python theme={null}
node_summaries = theme_tree.get_summaries()
node_summaries
```
## Retrieve Content
With the theme taxonomy and screening parameters, you can leverage the Bigdata API to run a search on company transcripts. We need to define 3 more parameters for searching:
* **Frequency** (`freq`): The frequency of the date ranges to search over. Supported values:
* `Y`: Yearly intervals.
* `M`: Monthly intervals.
* `W`: Weekly intervals.
* `D`: Daily intervals. Defaults to `3M`.
* **Document Limit** (`document_limit`): The maximum number of documents to return per query to Bigdata API.
* **Batch Size** (`batch_size`): The number of entities to include in a single batched query.
```python theme={null}
freq = "6M"
document_limit = 100
batch_size = 10
df_sentences = search_by_companies(
companies=companies,
sentences=node_summaries,
start_date=start_date,
end_date=end_date,
scope=document_type,
fiscal_year=fiscal_year,
rerank_threshold=rerank_threshold,
freq=freq,
document_limit=document_limit,
batch_size=batch_size,
)
df_sentences.head(5)
```
**DataFrame Summary:** 5 rows × 16 columns
| # | Timestamp UTC | RP Document ID | Sentence ID | Headline | Entity Name | Text | Masked Text |
| - | ------------------------- | -------------------------------- | ---------------------------------- | ------------------------------------------------------------- | ----------- | ---------------------------------------------------------------------------------------------------------------------------------------------------------------------------------------------------------------------------------------------------------------------------------------------------------------------------------------------------------------------------------------------------------------------------------------------------------------------------------------------------------------------------------------------------------------------------------------------------------------------------------------------------------------------------------------------------------------------------------------------------------------------------------------------------------------------------------------------------- | ------------------------------------------------------------------------------------------------------------------------------------------------------------------------------------------------------------------------------------------------------------------------------------------------------------------------------------------------------------------------------------------------------------------------------------------------------------------------------------------------------------------------------------------------------------------------------------------------------------------------------------------------------------------------------------------------------------------------------------------------------------------------------------------------------------------------------------------------------------------------------------------------------------------------------------- |
| 0 | 2024-03-21 09:00:00+00:00 | 381E04DC8007FBF551D807540B70FAEA | 381E04DC8007FBF551D807540B70FAEA-0 | ABB: 2024 Annual General Meeting on Mar 21, 2024 - Transcript | ABB Ltd. | But the climate crisis also opens up a plethora of opportunities for APB. After all, we have the innovative technologies, products and solutions that make it possible to stem the tide of climate change. Robotics and automation also play a crucial role here as they enable enterprises to utilize precious resources more economically. This starts with raw materials and continues all the way to recycling. ABB's digitalization and automation solutions also help our customers work and manufacture their products more effectively and efficiently to support the critical transition to the circular economy and ultimately improve their competitive edge. | But the climate crisis also opens up a plethora of opportunities for APB. After all, Target Company have the innovative technologies, products and solutions that make it possible to stem the tide of climate change. Robotics and automation also play a crucial role here as they enable enterprises to utilize precious resources more economically. This starts with raw materials and continues all the way to recycling. Target Company's digitalization and automation solutions also help Target Company customers work and manufacture their products more effectively and efficiently to support the critical transition to the circular economy and ultimately improve their competitive edge. |
| 1 | 2024-03-21 09:00:00+00:00 | 381E04DC8007FBF551D807540B70FAEA | 381E04DC8007FBF551D807540B70FAEA-2 | ABB: 2024 Annual General Meeting on Mar 21, 2024 - Transcript | ABB Ltd. | The significance of AI extends beyond merely enhancing work processes or executing tasks with greater speed, precision and autonomy through machine vision. Generative AI is democratizing access to automation and robotics, not just for technologists or software engineers, but for everyone. As long as people think clearly and logically, they can instruct the system on their desired outcomes, thereby unlocking the full potential of AI for every manager and worker alike. Clearly, all of this necessitates the establishment of clear standards to ensure that both we and our customers can leverage the power of AI safely and responsibly. And I want to state unequivocally that our society must enact regulations governing the use of AI. | The significance of AI extends beyond merely enhancing work processes or executing tasks with greater speed, precision and autonomy through machine vision. Generative AI is democratizing access to automation and robotics, not just for technologists or software engineers, but for everyone. As long as people think clearly and logically, they can instruct the system on their desired outcomes, thereby unlocking the full potential of AI for every manager and worker alike. Clearly, all of this necessitates the establishment of clear standards to ensure that both Target Company and Target Company customers can leverage the power of AI safely and responsibly. And I want to state unequivocally that Target Company society must enact regulations governing the use of AI. |
| 2 | 2024-03-21 09:00:00+00:00 | 381E04DC8007FBF551D807540B70FAEA | 381E04DC8007FBF551D807540B70FAEA-3 | ABB: 2024 Annual General Meeting on Mar 21, 2024 - Transcript | ABB Ltd. | The situation in the Middle East is deeply concerning. Vital shipping routes have been disrupted and geopolitical tensions show no sign of easing. In short, the macroeconomic and political environment is volatile. It was in the last year and it is in this year and it is profoundly uncertain. In times like these, it is essential for businesses to ensure that they are well positioned strategically Rather than allowing uncertainty to undermine our ambitions, companies must become resilient to crises and well as more agile and sustainable. | The situation in the Middle East is deeply concerning. Vital shipping routes have been disrupted and geopolitical tensions show no sign of easing. In short, the macroeconomic and political environment is volatile. It was in the last year and it is in this year and it is profoundly uncertain. In times like these, it is essential for businesses to ensure that they are well positioned strategically Rather than allowing uncertainty to undermine Target Company ambitions, companies must become resilient to crises and well as more agile and sustainable. |
| 3 | 2024-03-21 09:00:00+00:00 | 381E04DC8007FBF551D807540B70FAEA | 381E04DC8007FBF551D807540B70FAEA-1 | ABB: 2024 Annual General Meeting on Mar 21, 2024 - Transcript | ABB Ltd. | The ABB way also plays a vital role here, for example, with our local for local strategy. ABB may be a global corporation, but we still need to reduce our dependencies on certain geographies. This is why in the USA, we now produce around 75% of products there. In China, it's approximately 85 percent and in Europe, about 95%. The result is more flexibility and resilience. And it's no different with what is likely to be the greatest challenge facing humanity today, climate change. Let me make one thing abundantly clear. The energy transition, the expansion of renewable energy sources and decarbonization of our economy are not negotiable. We must tackle climate change. We owe it to ourselves and to future generations. | The Target Company way also plays a vital role here, for example, with Target Company local for local strategy. Target Company may be a global corporation, but Target Company still need to reduce Target Company dependencies on certain geographies. This is why in the USA, Target Company now produce around 75% of products there. In China, it's approximately 85 percent and in Europe, about 95%. The result is more flexibility and resilience. And it's no different with what is likely to be the greatest challenge facing humanity today, climate change. Let me make one thing abundantly clear. The energy transition, the expansion of renewable energy sources and decarbonization of Target Company economy are not negotiable. Target Company must tackle climate change. Target Company owe it to ourselves and to future generations. |
| 4 | 2024-03-21 09:00:00+00:00 | 381E04DC8007FBF551D807540B70FAEA | 381E04DC8007FBF551D807540B70FAEA-1 | ABB: 2024 Annual General Meeting on Mar 21, 2024 - Transcript | ABB Ltd. | Distinguished shareholders, Bjorn did a fantastic job for ABB. Please give him a round of applause. I'm also proud that we've found a competent successor from our own ranks in Morten Virod as he's actually here as well in one of the first rows. As you know, Bjorn will be handing over the management of the company to Morten in the course of the year. Morten is very familiar with ABB and has a deep understanding of our decentralized business model, which he will continue to strengthen. This will allow us to guarantee continuity and ensure that ABB can continue on its successful trajectory. All the best, and I look forward to working with you, Morton. I spoke earlier about the need for us to be resilient in the face of crises. This also means maintaining short supply chains and direct proximity to our customers. | Distinguished shareholders, Bjorn did a fantastic job for Target Company. Please give him a round of applause. I'm also proud that Target Company've found a competent successor from Target Company own ranks in Morten Virod as he's actually here as well in one of the first rows. As you know, Bjorn will be handing over the management of Target Company to Morten in the course of the year. Morten is very familiar with Target Company and has a deep understanding of Target Company decentralized business model, which he will continue to strengthen. This will allow us to guarantee continuity and ensure that Target Company can continue on its successful trajectory. All the best, and I look forward to working with you, Morton. I spoke earlier about the need for us to be resilient in the face of crises. This also means maintaining short supply chains and direct proximity to Target Company customers. |
**Additional Columns:** Masked Text, RP Entity ID, Entity Sector, Entity Industry, Entity Country, Entity Ticker, Other Entities, Entities, Other Entities Map
## Label the Results
Use an LLM to analyze each text chunk and determine its relevance to the sub-themes. Any chunks which aren't explicitly linked to supply chain reshaping will be filtered out.
```python theme={null}
labeler = ScreenerLabeler(llm_model=llm_model)
df_labels = labeler.get_labels(
main_theme=main_theme,
labels=list(theme_tree.get_terminal_label_summaries().keys()),
texts=df_sentences["masked_text"].tolist(),
)
# Merge and process results
df = merge(df_sentences, df_labels, left_index=True, right_index=True)
df = labeler.post_process_dataframe(df)
```
## Assess Thematic Exposure
We'll look at the top 10 most exposed companies to supply chain reshaping. The function `get_scored_df` will calculate the composite thematic score, summing up the scores across the sub-themes for each company (`df_company`) or industry (`df_industry`).
```python theme={null}
df_company, df_industry = DataFrame(), DataFrame()
df_company = get_scored_df(
df, index_columns=["Company", "Ticker", "Industry"], pivot_column="Theme"
)
df_industry = get_scored_df(
df, index_columns=["Industry"], pivot_column="Theme"
)
```
Now, let's visualize the results using Plotly to create an interactive dashboard:
```python [expandable] theme={null}
import pandas as pd
import numpy as np
import plotly.graph_objects as go
from plotly.subplots import make_subplots
import plotly.io as pio
import plotly.offline
pio.renderers.default = 'colab'
plotly.offline.init_notebook_mode()
def create_thematic_exposure_dashboard(df_company, n_companies=10):
"""
Creates five separate figures for analyzing thematic exposure of companies.
Parameters:
-----------
df_company : pandas.DataFrame
DataFrame containing company data with columns for 'Company', 'Industry',
'Composite Score', and multiple thematic exposure columns.
n_companies : int, default=10
Number of companies to include in the analysis.
Returns:
--------
tuple
A tuple containing five Plotly figures:
- fig_heatmap: Company-theme exposure heatmap
- fig_total_scores: Total composite scores bar chart
- fig_scatter_themes: Top themes scatter plot by company
- fig_bar_themes: Thematic scores horizontal bar chart
- fig_industry_heatmap: Industry-level analysis heatmap
"""
# Select top n companies and reset index
df = df_company[:n_companies].reset_index(drop=True).copy()
# Extract theme column names (all columns between 'Industry' and 'Composite Score')
theme_columns = list(df.iloc[:, 3:-1].columns)
# Create all figures
fig_heatmap = create_company_theme_heatmap(df, theme_columns)
fig_total_scores = create_company_scores_bar_chart(df)
fig_scatter_themes = create_top_themes_scatter_plot(df, theme_columns)
fig_bar_themes = create_themes_summary_bar_chart(df, theme_columns)
fig_industry_heatmap = create_industry_analysis_heatmap(df, theme_columns)
return fig_heatmap, fig_total_scores, fig_scatter_themes, fig_bar_themes, fig_industry_heatmap
def create_company_theme_heatmap(df, theme_columns):
"""
Creates a heatmap showing thematic exposure scores for each company.
Parameters:
-----------
df : pandas.DataFrame
The data frame containing company and theme data
theme_columns : list
List of column names representing thematic categories
Returns:
--------
plotly.graph_objects.Figure
Heatmap figure with color scale
"""
fig = go.Figure()
heatmap_z = df[theme_columns].values
heatmap_x = theme_columns
heatmap_y = df['Company'].tolist()
fig.add_trace(
go.Heatmap(
z=heatmap_z,
x=heatmap_x,
y=heatmap_y,
colorscale='YlGnBu',
text=heatmap_z.astype(int),
texttemplate="%{text}",
showscale=True,
)
)
fig.update_layout(
title='Company Thematic Exposure Heatmap (Raw Scores)',
height=600,
width=1200,
margin=dict(l=60, r=50, t=80, b=50),
xaxis=dict(tickangle=45, tickfont=dict(size=9)),
yaxis=dict(title="Company")
)
return fig
def create_company_scores_bar_chart(df):
"""
Creates a horizontal bar chart showing total composite scores for companies.
Parameters:
-----------
df : pandas.DataFrame
The data frame containing company scores
Returns:
--------
plotly.graph_objects.Figure
Bar chart figure showing total composite scores
"""
fig = go.Figure()
companies = df['Company'].tolist()
total_scores = df['Composite Score'].tolist()
# Sort by score for better visualization (highest first)
sorted_indices = np.argsort(total_scores)[::-1]
sorted_companies = [companies[i] for i in sorted_indices]
sorted_scores = [total_scores[i] for i in sorted_indices]
fig.add_trace(
go.Bar(
y=sorted_companies,
x=sorted_scores,
orientation='h',
marker=dict(
color=sorted_scores,
colorscale='Viridis',
showscale=False
),
text=sorted_scores,
textposition='outside',
textfont=dict(size=10),
)
)
fig.update_layout(
title='Company Total Composite Scores',
height=600,
width=1200,
margin=dict(l=60, r=50, t=80, b=50),
xaxis=dict(title="Total Composite Score"),
yaxis=dict(title="Company")
)
return fig
def create_top_themes_scatter_plot(df, theme_columns):
"""
Creates a scatter plot showing the top 3 thematic exposures for each company.
Parameters:
-----------
df : pandas.DataFrame
The data frame containing company and theme data
theme_columns : list
List of column names representing thematic categories
Returns:
--------
plotly.graph_objects.Figure
Scatter plot showing top themes by company
"""
fig = go.Figure()
max_score = df[theme_columns].values.max()
companies_unique = df['Company'].unique()
for i, company in enumerate(companies_unique):
company_data = df[df['Company'] == company]
if len(company_data) == 0:
continue
company_row = company_data.iloc[0]
company_scores = company_row[theme_columns].values
top_indices = np.argsort(company_scores)[-3:]
x_values = []
y_values = []
sizes = []
hover_texts = []
for idx in top_indices:
if company_scores[idx] > 0:
theme = theme_columns[idx]
score = company_scores[idx]
size = (score / max_score) * 80
x_values.append(company)
y_values.append(theme)
sizes.append(size)
hover_texts.append(f"{company}
{theme}: {int(score)}")
if len(x_values) > 0:
fig.add_trace(
go.Scatter(
x=x_values,
y=y_values,
mode='markers',
marker=dict(
size=sizes,
sizemode='area',
sizeref=0.15,
color=i,
colorscale='Turbo',
showscale=False,
opacity=0.7,
line=dict(width=1, color='DarkSlateGrey'),
),
text=hover_texts,
hoverinfo='text',
name=company,
)
)
fig.update_layout(
height=600,
width=1200,
title_text="Top 3 Thematic Exposures by Company",
showlegend=False,
margin=dict(l=60, r=50, t=80, b=50),
)
fig.update_xaxes(title_text="Company")
fig.update_yaxes(title_text="Theme")
return fig
def create_themes_summary_bar_chart(df, theme_columns):
"""
Creates a horizontal bar chart showing total scores across all themes.
Uses a red color palette that never goes to white.
Parameters:
-----------
df : pandas.DataFrame
The data frame containing company and theme data
theme_columns : list
List of column names representing thematic categories
Returns:
--------
plotly.graph_objects.Figure
Horizontal bar chart showing thematic scores summary
"""
fig = go.Figure()
# Calculate theme totals across all companies
theme_totals = df[theme_columns].sum()
theme_names = theme_totals.index.tolist()
theme_values = theme_totals.values.tolist()
# Sort by values (descending)
sorted_indices = np.argsort(theme_values)[::-1]
sorted_themes = [theme_names[i] for i in sorted_indices]
sorted_values = [theme_values[i] for i in sorted_indices]
# Create custom color scale that never goes to white
normalized_values = np.array(sorted_values)
normalized_values = (normalized_values - normalized_values.min()) / (normalized_values.max() - normalized_values.min())
# Scale to range 0.3 to 1.0 to avoid white colors
color_values = 0.3 + (normalized_values * 0.7)
fig.add_trace(
go.Bar(
y=sorted_themes,
x=sorted_values,
orientation='h',
marker=dict(
color=color_values,
colorscale=[[0, '#8B0000'], [1, '#FF4500']], # Dark red to orange-red, no white
showscale=False
),
text=sorted_values,
textposition='outside',
textfont=dict(size=10),
)
)
fig.update_layout(
height=600,
width=1200,
title_text="Total Thematic Scores Summary",
showlegend=False,
margin=dict(l=60, r=50, t=80, b=50),
)
fig.update_xaxes(title_text="Total Score Across All Companies")
fig.update_yaxes(title_text="Theme")
return fig
def create_industry_analysis_heatmap(df, theme_columns):
"""
Creates a heatmap showing average thematic scores grouped by industry.
Parameters:
-----------
df : pandas.DataFrame
The data frame containing company and industry data
theme_columns : list
List of column names representing thematic categories
Returns:
--------
plotly.graph_objects.Figure
Heatmap figure showing industry-level thematic analysis
"""
# Group by industry and calculate mean scores
industry_data = []
for industry, group in df.groupby('Industry'):
for theme in theme_columns:
industry_data.append({
'Industry': industry,
'Theme': theme,
'Average_Score': group[theme].mean()
})
industry_df = pd.DataFrame(industry_data)
# Create a pivot table for the heatmap
industry_pivot = industry_df.pivot(index='Industry', columns='Theme', values='Average_Score')
# Create the industry analysis figure
fig = go.Figure(data=go.Heatmap(
z=industry_pivot.values,
x=industry_pivot.columns,
y=industry_pivot.index,
colorscale='YlOrRd',
text=np.round(industry_pivot.values, 1),
texttemplate="%{text}",
showscale=True,
))
# Format the industry analysis figure
fig.update_layout(
title='Industry-Level Thematic Exposure Analysis (Average Scores)',
height=500,
width=1200,
margin=dict(l=60, r=50, t=80, b=50),
xaxis=dict(tickangle=45, tickfont=dict(size=9)),
yaxis=dict(title="Industry")
)
return fig
# Enable custom widget manager for Colab
from google.colab import output
output.enable_custom_widget_manager()
# Alternative display method using HTML
from IPython.display import HTML
# Create the dashboard with all figures
fig_heatmap, fig_total_scores, fig_scatter_themes, fig_bar_themes, fig_industry_heatmap = create_thematic_exposure_dashboard(df_company)
# Convert figures to HTML for display
html_heatmap = fig_heatmap.to_html(include_plotlyjs='cdn')
html_total_scores = fig_total_scores.to_html(include_plotlyjs='cdn')
html_scatter_themes = fig_scatter_themes.to_html(include_plotlyjs='cdn')
html_bar_themes = fig_bar_themes.to_html(include_plotlyjs='cdn')
html_industry_heatmap = fig_industry_heatmap.to_html(include_plotlyjs='cdn')
# Display all figures
print("\n")
display(HTML(html_heatmap))
print("\n")
display(HTML(html_total_scores))
print("\n")
display(HTML(html_scatter_themes))
print("\n")
display(HTML(html_bar_themes))
print("\n")
display(HTML(html_industry_heatmap))
```
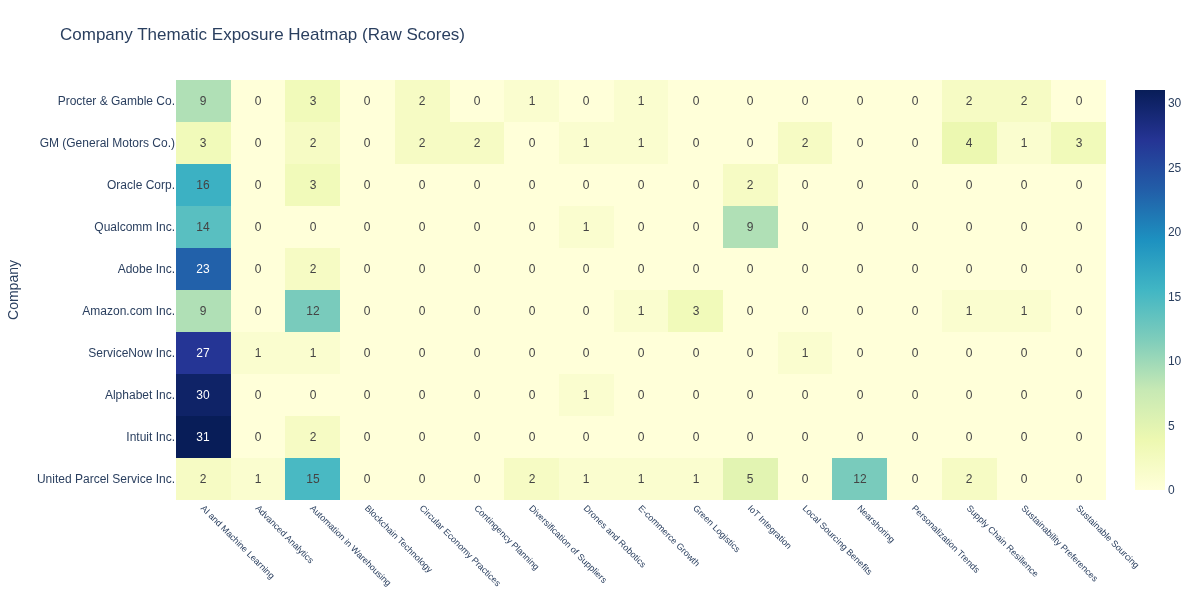
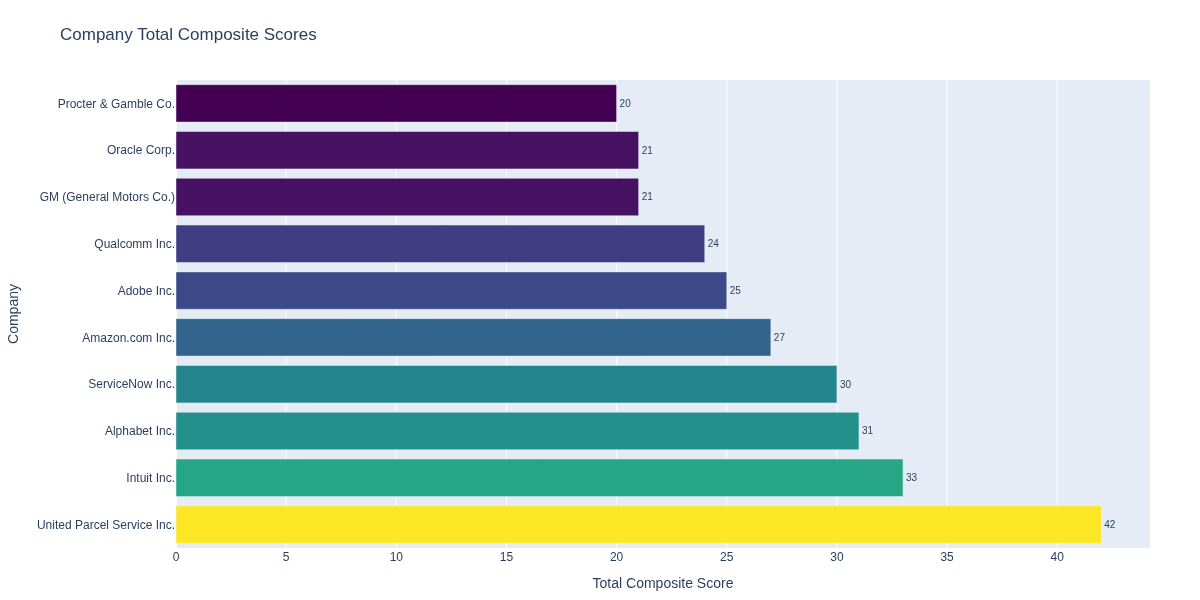
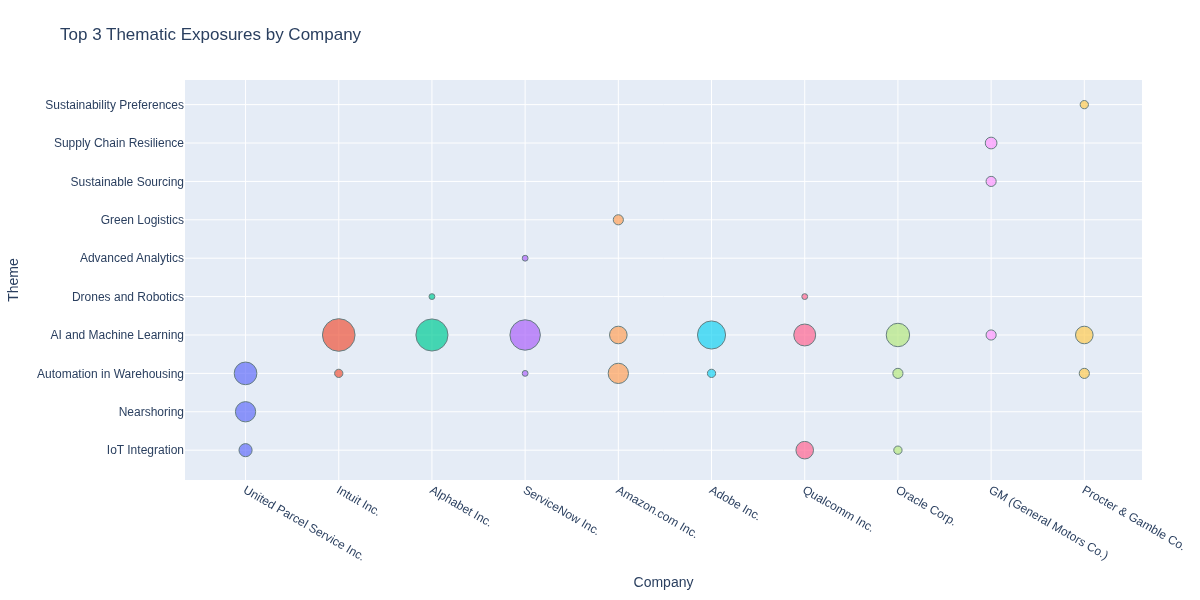
 ## Extract Key Insights
The visualizations reveal key insights about how companies are positioning themselves within the supply chain reshaping theme:
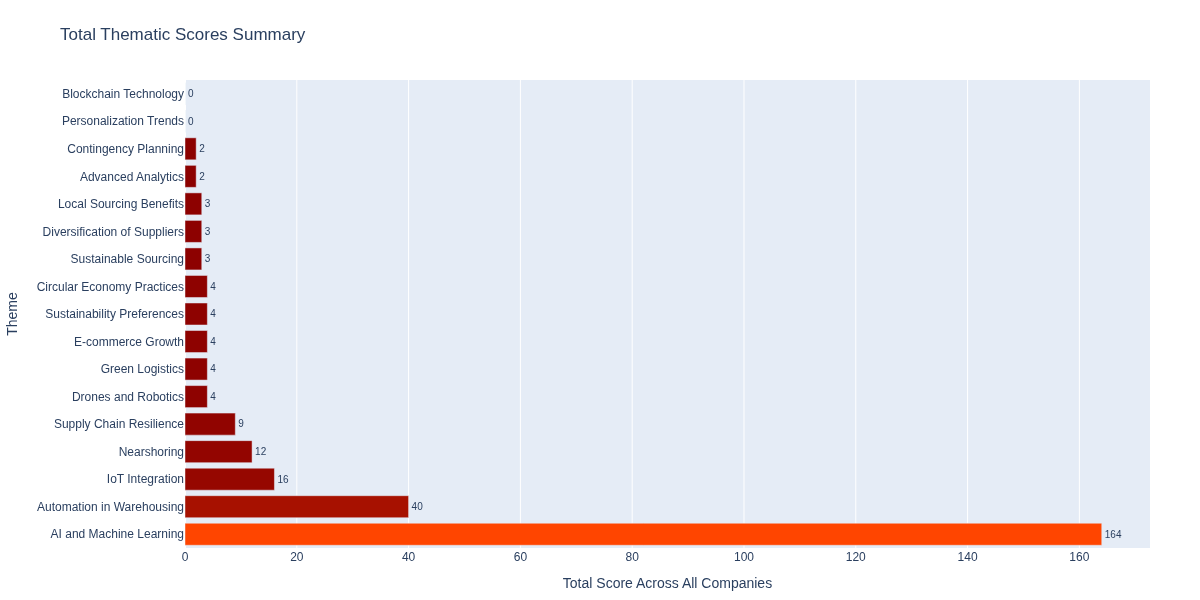
With the highest cumulative score across all companies, AI and Machine Learning is the most dominant theme, highlighting its foundational role in predictive analytics, automation, and optimization within modern supply chains.
The strong presence of Circular Economy Practices and Automation & Robotics indicates a structural shift toward sustainable and efficient supply chain models—companies are not just digitizing but rethinking operational design.
Siemens AG, Infineon Technologies AG, and Qualcomm Inc. are the frontrunners in thematic exposure, underscoring that companies at the intersection of industrial technology and digital infrastructure are best positioned to drive—and benefit from—supply chain transformation.
IoT's high ranking shows its critical role in connecting assets, enabling real-time visibility, and facilitating advanced automation, especially for manufacturers and hardware-driven firms.
### Industry Polarisation
#### Sector Engagement
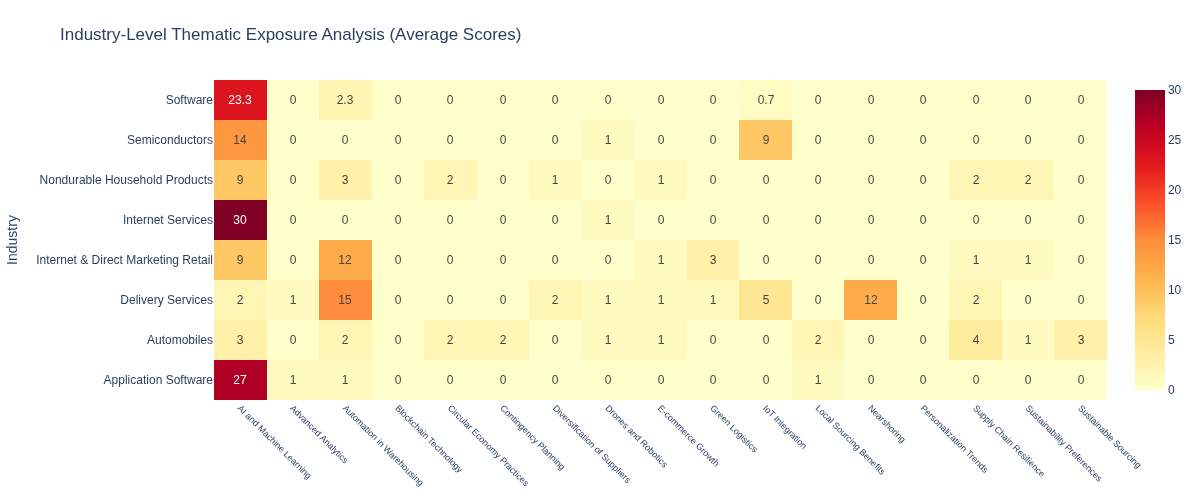
* **Semiconductors and Computer Services** industries show the strongest average exposure, reflecting their integral role in enabling supply chain tech (e.g., sensors, connectivity, software).
* **Traditional Sectors** like Diversified Industrials show broader but shallower engagement, suggesting they are still in earlier phases of thematic adoption.
#### Strategic Focus
**Concentration vs. Diversification in Exposure**
Most companies exhibit thematic concentration, focusing efforts on a few high-impact areas rather than spreading across all themes—likely reflecting strategic prioritization rather than lack of alignment.
## Export the Results
Export the data as Excel files for further analysis or to share with the team.
```python theme={null}
try:
# Create the Excel manager
excel_manager = ExcelManager()
# Define the dataframes and their sheet configurations
df_args = [
(df, "Semantic Labels", (0, 0)),
(df_company, "By Company", (2, 4)),
(df_industry, "By Industry", (2, 2))
]
# Save the workbook
excel_manager.save_workbook(df_args, export_path)
except Exception as e:
print(f"Warning while exporting to excel: {e}")
```
## Conclusion
The Thematic Screener provides a powerful way to identify companies that are most aligned with or exposed to specific investment themes. By leveraging BigData's search capabilities and applying LLM-based classification, you can:
1. **Discover thematic leaders** - Find companies with the strongest strategic alignment to emerging trends
2. **Compare across industries** - Identify which sectors are most proactive in addressing thematic challenges and opportunities
3. **Identify investment opportunities** - Spot companies that may be undervalued relative to their thematic positioning
4. **Monitor thematic evolution** - Track how themes gain or lose prominence across your investment universe over time
Whether you're building thematic portfolios, conducting sector research, or seeking alpha through theme-based strategies, the Thematic Screener transforms unstructured data into structured, decision-ready intelligence.
## Extract Key Insights
The visualizations reveal key insights about how companies are positioning themselves within the supply chain reshaping theme:
With the highest cumulative score across all companies, AI and Machine Learning is the most dominant theme, highlighting its foundational role in predictive analytics, automation, and optimization within modern supply chains.
The strong presence of Circular Economy Practices and Automation & Robotics indicates a structural shift toward sustainable and efficient supply chain models—companies are not just digitizing but rethinking operational design.
Siemens AG, Infineon Technologies AG, and Qualcomm Inc. are the frontrunners in thematic exposure, underscoring that companies at the intersection of industrial technology and digital infrastructure are best positioned to drive—and benefit from—supply chain transformation.
IoT's high ranking shows its critical role in connecting assets, enabling real-time visibility, and facilitating advanced automation, especially for manufacturers and hardware-driven firms.
### Industry Polarisation
#### Sector Engagement
* **Semiconductors and Computer Services** industries show the strongest average exposure, reflecting their integral role in enabling supply chain tech (e.g., sensors, connectivity, software).
* **Traditional Sectors** like Diversified Industrials show broader but shallower engagement, suggesting they are still in earlier phases of thematic adoption.
#### Strategic Focus
**Concentration vs. Diversification in Exposure**
Most companies exhibit thematic concentration, focusing efforts on a few high-impact areas rather than spreading across all themes—likely reflecting strategic prioritization rather than lack of alignment.
## Export the Results
Export the data as Excel files for further analysis or to share with the team.
```python theme={null}
try:
# Create the Excel manager
excel_manager = ExcelManager()
# Define the dataframes and their sheet configurations
df_args = [
(df, "Semantic Labels", (0, 0)),
(df_company, "By Company", (2, 4)),
(df_industry, "By Industry", (2, 2))
]
# Save the workbook
excel_manager.save_workbook(df_args, export_path)
except Exception as e:
print(f"Warning while exporting to excel: {e}")
```
## Conclusion
The Thematic Screener provides a powerful way to identify companies that are most aligned with or exposed to specific investment themes. By leveraging BigData's search capabilities and applying LLM-based classification, you can:
1. **Discover thematic leaders** - Find companies with the strongest strategic alignment to emerging trends
2. **Compare across industries** - Identify which sectors are most proactive in addressing thematic challenges and opportunities
3. **Identify investment opportunities** - Spot companies that may be undervalued relative to their thematic positioning
4. **Monitor thematic evolution** - Track how themes gain or lose prominence across your investment universe over time
Whether you're building thematic portfolios, conducting sector research, or seeking alpha through theme-based strategies, the Thematic Screener transforms unstructured data into structured, decision-ready intelligence.