April 25, 2026
Search, API, Screening/8 minutes read
When teams screen a large universe for a theme, the first reliable pattern is usually a full grid: split the universe into manageable company groups, split the time range into windows, run Search across every slice, and collect the results. It is comprehensive, auditable, and easy to reason about.
The challenge is allocation. A full grid gives every company-time slice the same request budget even though coverage is rarely distributed evenly. Some names and periods carry most of the relevant evidence. Others have little or no coverage for the theme being screened. When the universe has thousands of names, uniform allocation can turn a straightforward research question into a long-running retrieval job.
Smart Batching is a planning layer for Bigdata.com Search that makes this allocation adaptive. It estimates volume before execution, groups entities with similar expected coverage, splits high-volume periods more carefully, and then runs Search with a proportional budget. The underlying retrieval remains Bigdata.com Search; Smart Batching decides where to spend the calls.
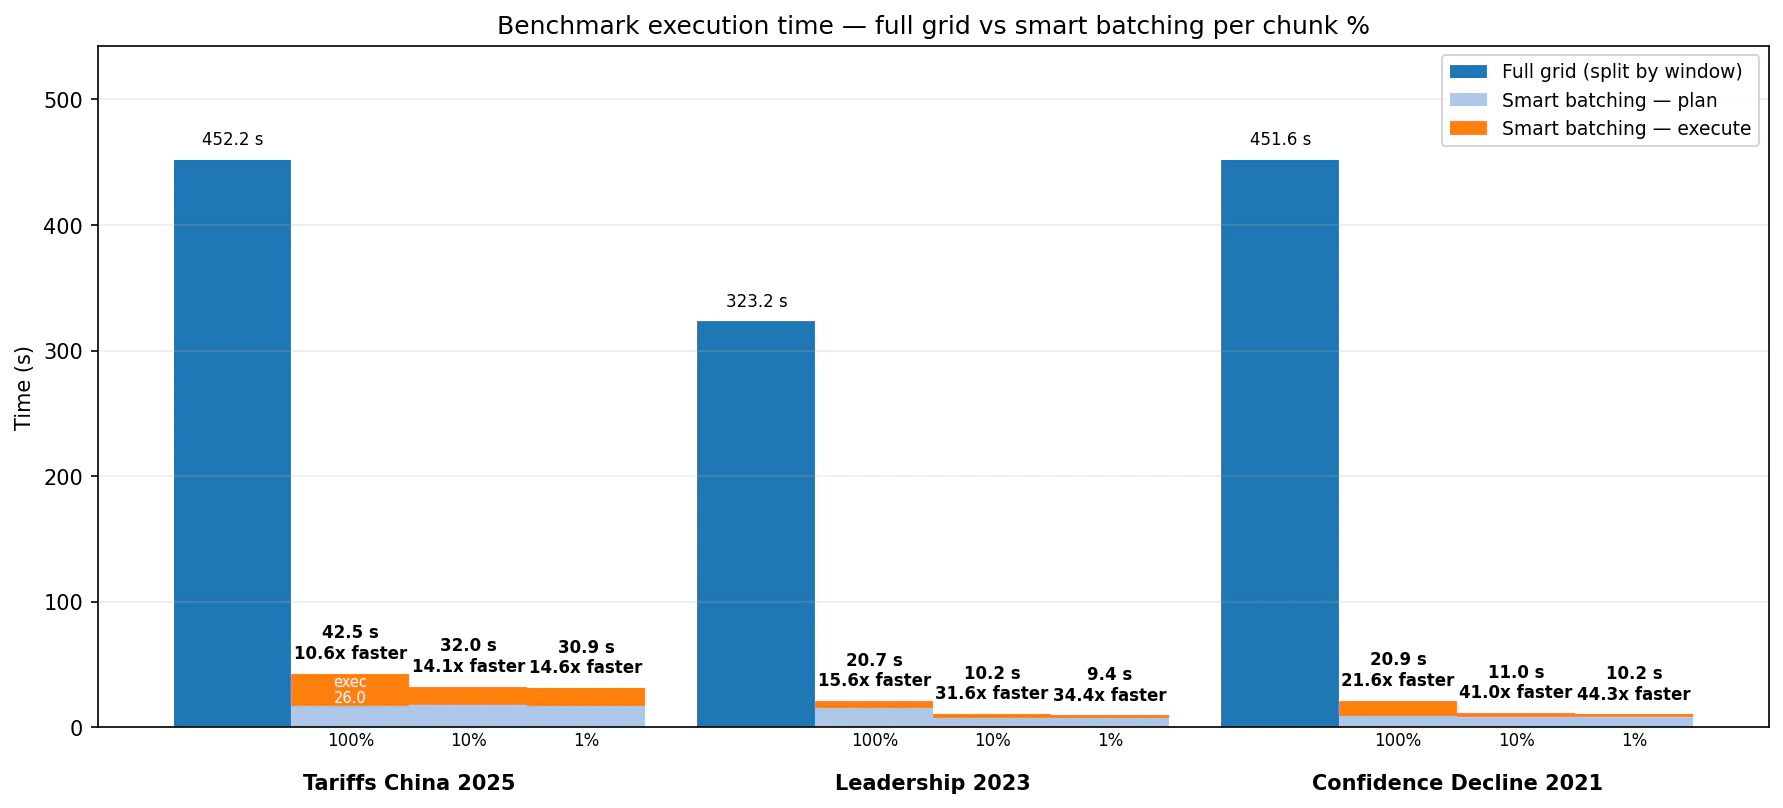
In benchmarks across three universe-scale screens, this plan-then-execute pattern cut runtime from several minutes to seconds: 10.6x to 21.6x faster at the 100% planned budget, and 14.6x to 44.3x faster at the 1% budget. The highest-relevance bins were strongly preserved in the tested scenarios, while lower budget settings concentrated the output into a smaller, more focused result set.
The Problem: Uniform Budgets
Imagine a six-month screen for companies affected by US import tariffs against China. Some semiconductor, retail, industrial, and logistics names will have meaningful coverage. Many other companies will have little direct exposure in the news flow for that topic. A full-grid search handles this by being exhaustive: each company group and time window gets queried. That is often the right baseline when completeness is the priority. But if the workflow is a recurring monitor, alert generator, LLM verification queue, or dashboard refresh, you may want a way to preserve the evidence-rich parts of the universe without spending the same budget on every quiet slice. Smart Batching addresses that operational problem. It is not a replacement for Search quality. It is a planner that makes large Search jobs more aware of the distribution of expected content.How Smart Batching Works
Smart Batching has two phases. The planning phase has two distinct substeps.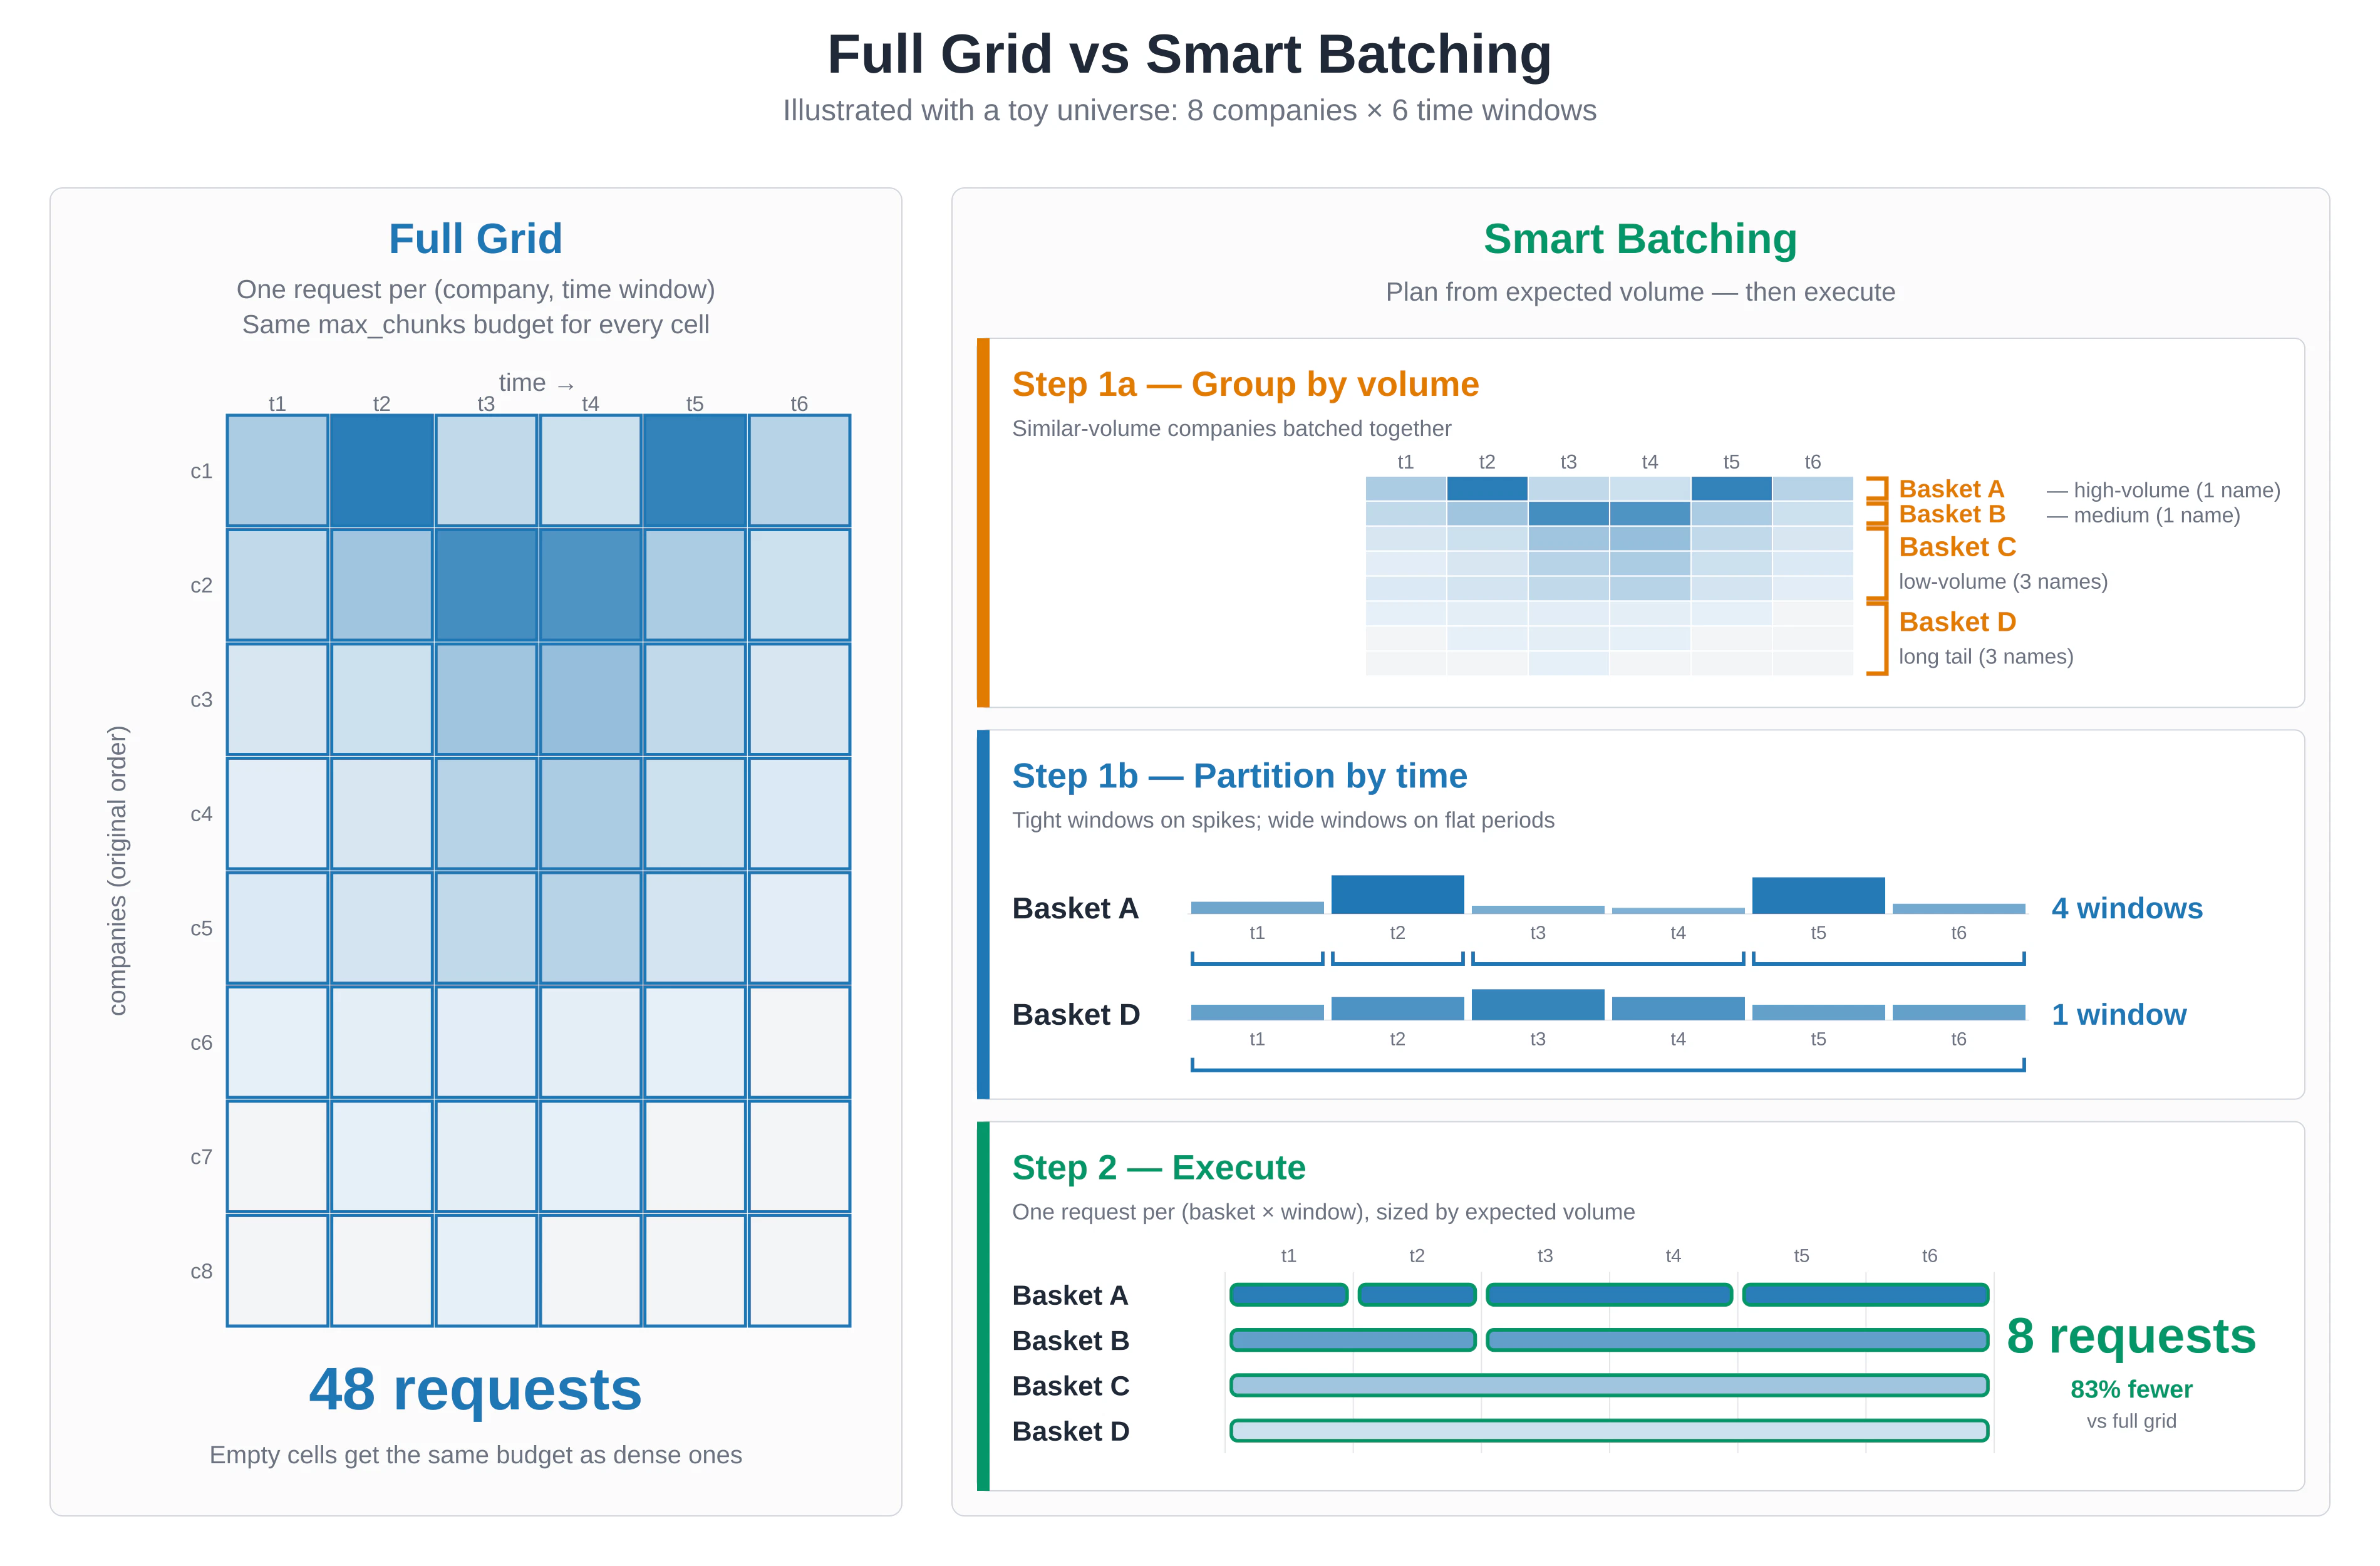
max_chunks allocation proportional to its expected volume and the selected chunk_percentage. A 10,000-chunk basket at chunk_percentage=0.01 requests about 100 chunks. A 50-chunk basket still receives a minimum budget so it remains represented.
That chunk_percentage setting is the main control:
1.0runs the full planned retrieval budget.0.1is a balanced setting for research workflows and dashboards.0.01is a signal-first setting for alerts, triage, and LLM verification.
Benchmark Design
We tested Smart Batching against a full-grid baseline on three screens over the historical US top-company universe:- Tariffs China 2025: “The company is affected by US import tariffs against China,” January to June 2025.
- Leadership 2023: “The company has faced leadership changes and executive appointments,” September to December 2023.
- Confidence Decline 2021: “Decline in customer confidence in the company,” January to June 2021.
Speed: minutes to seconds
What happens to relevance?
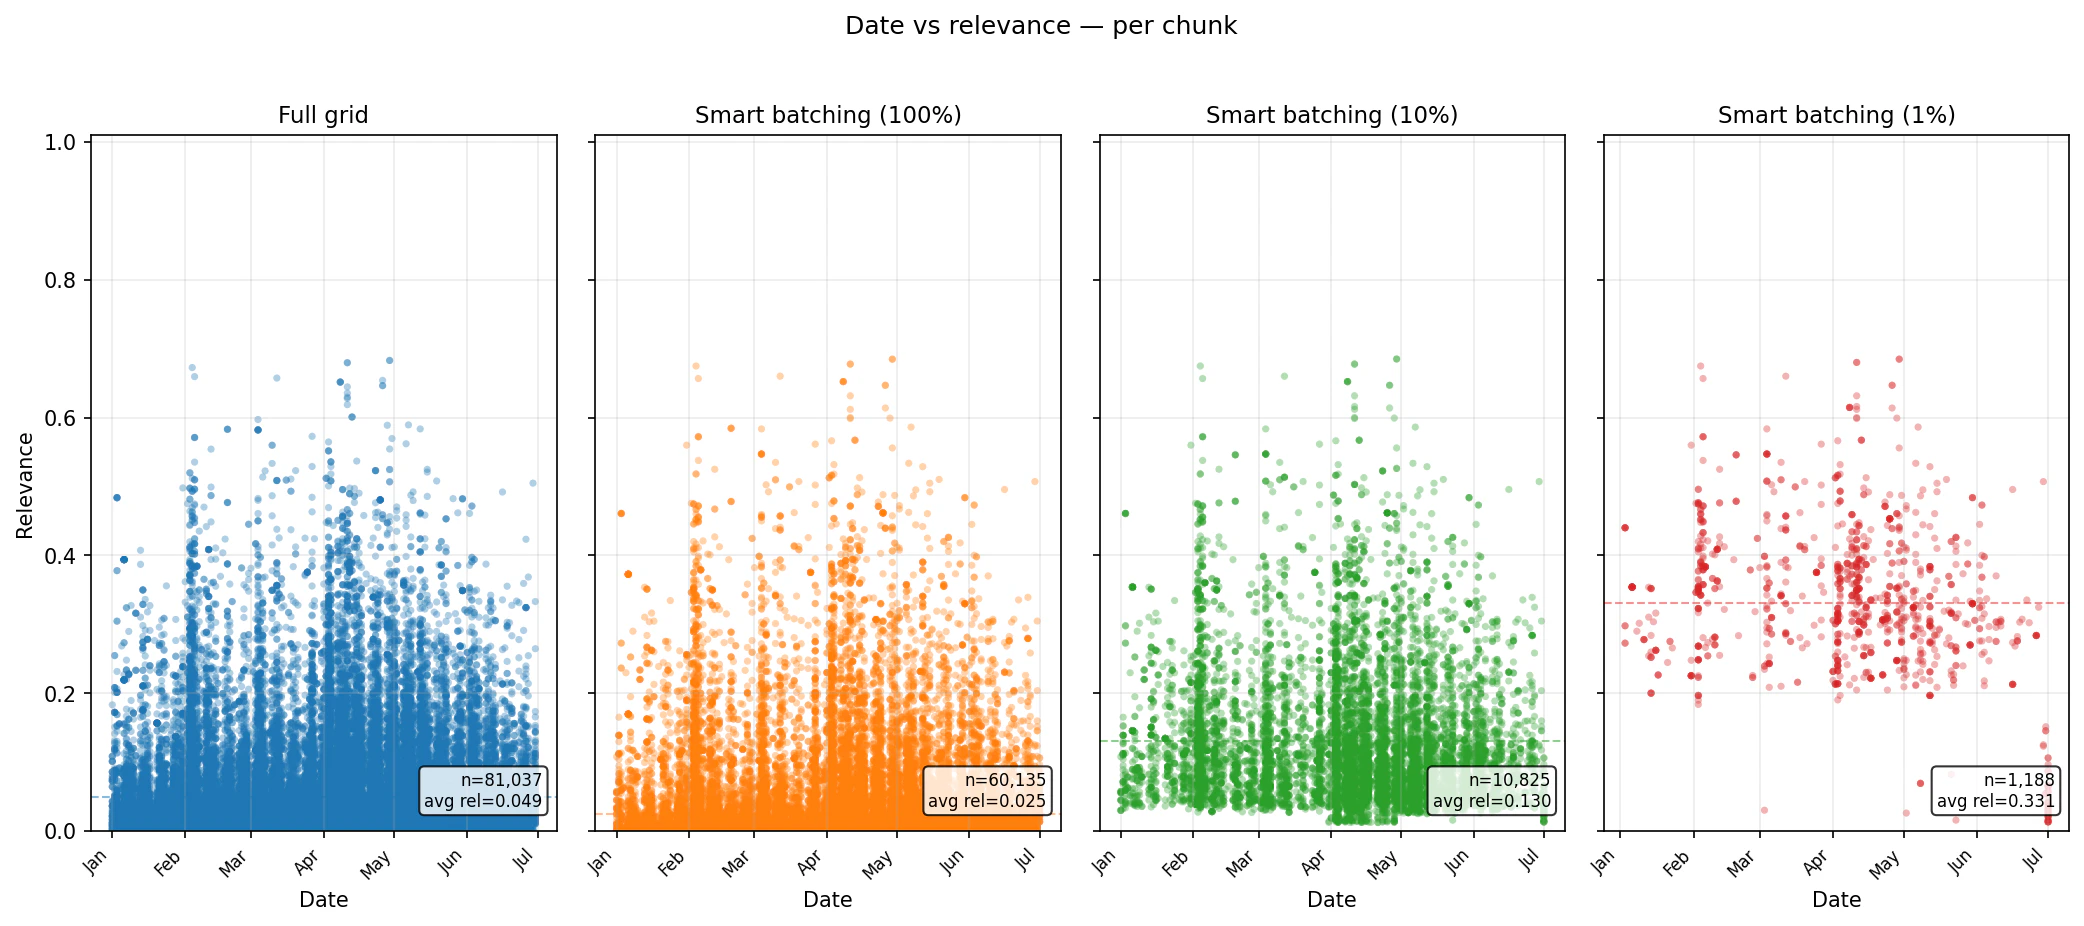
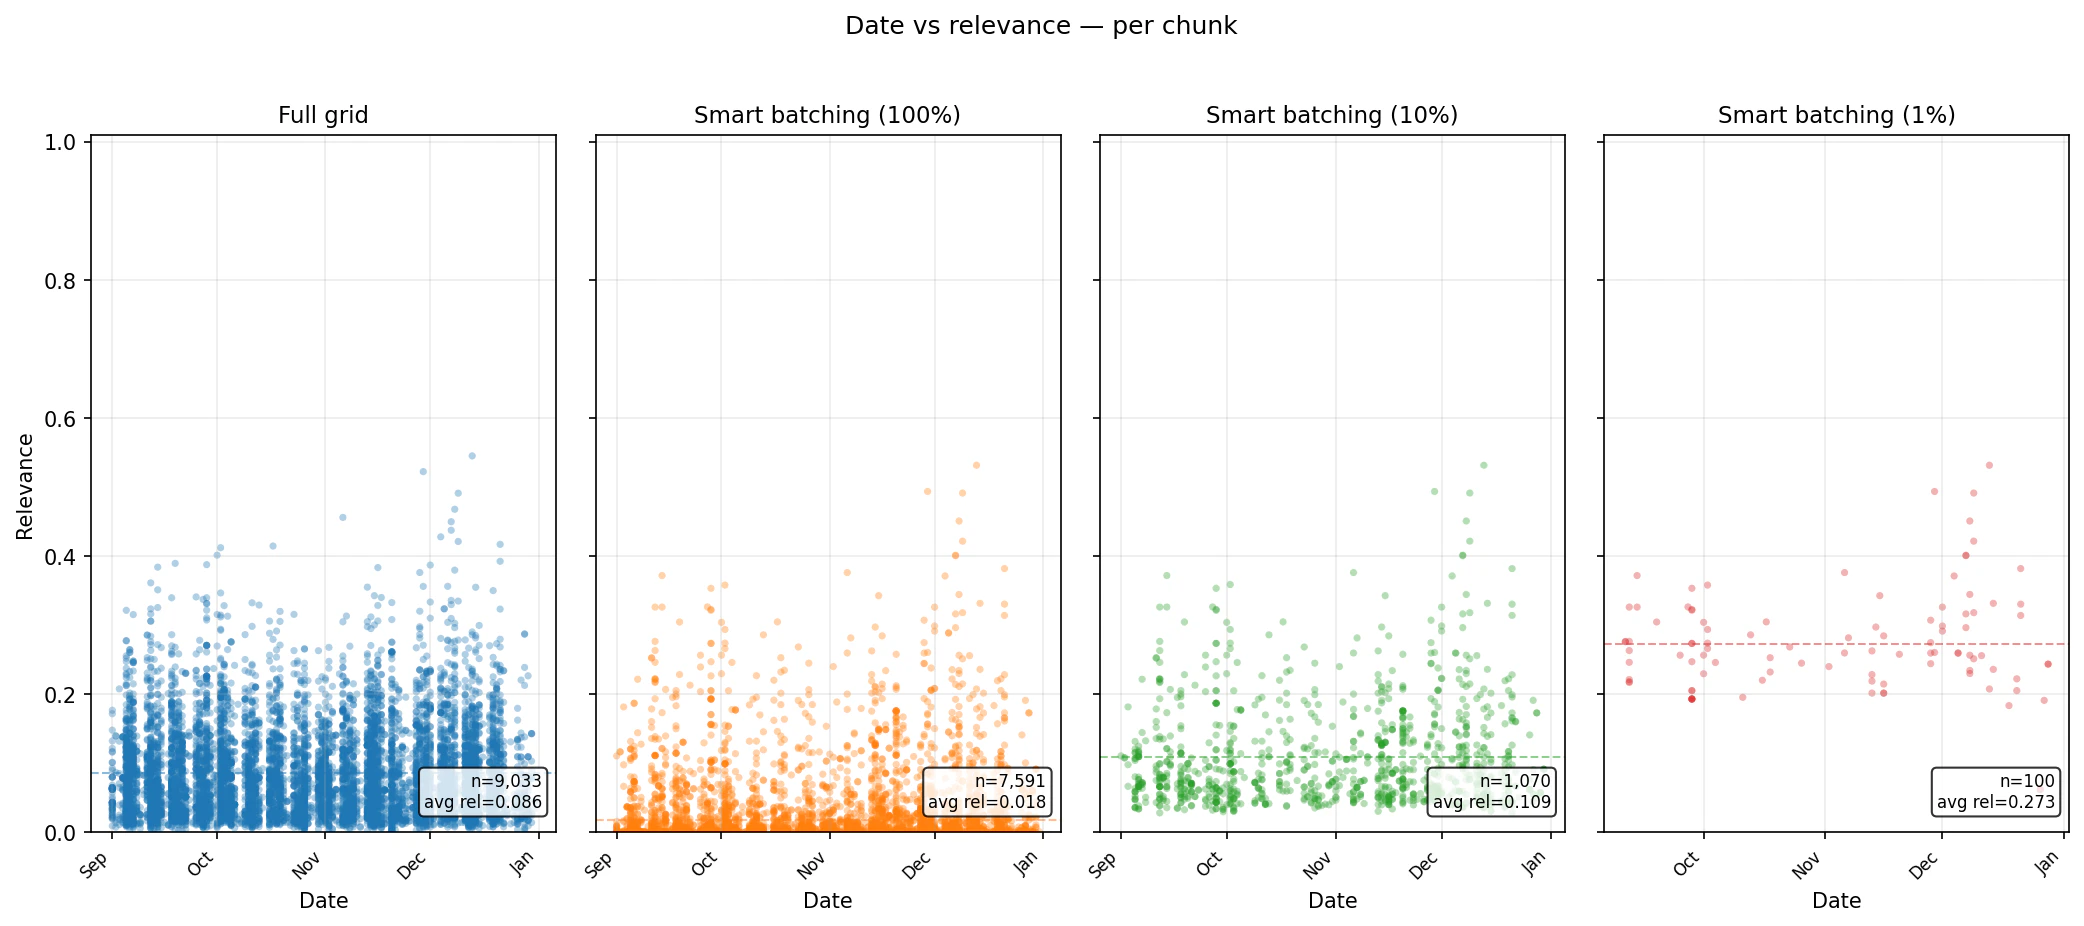
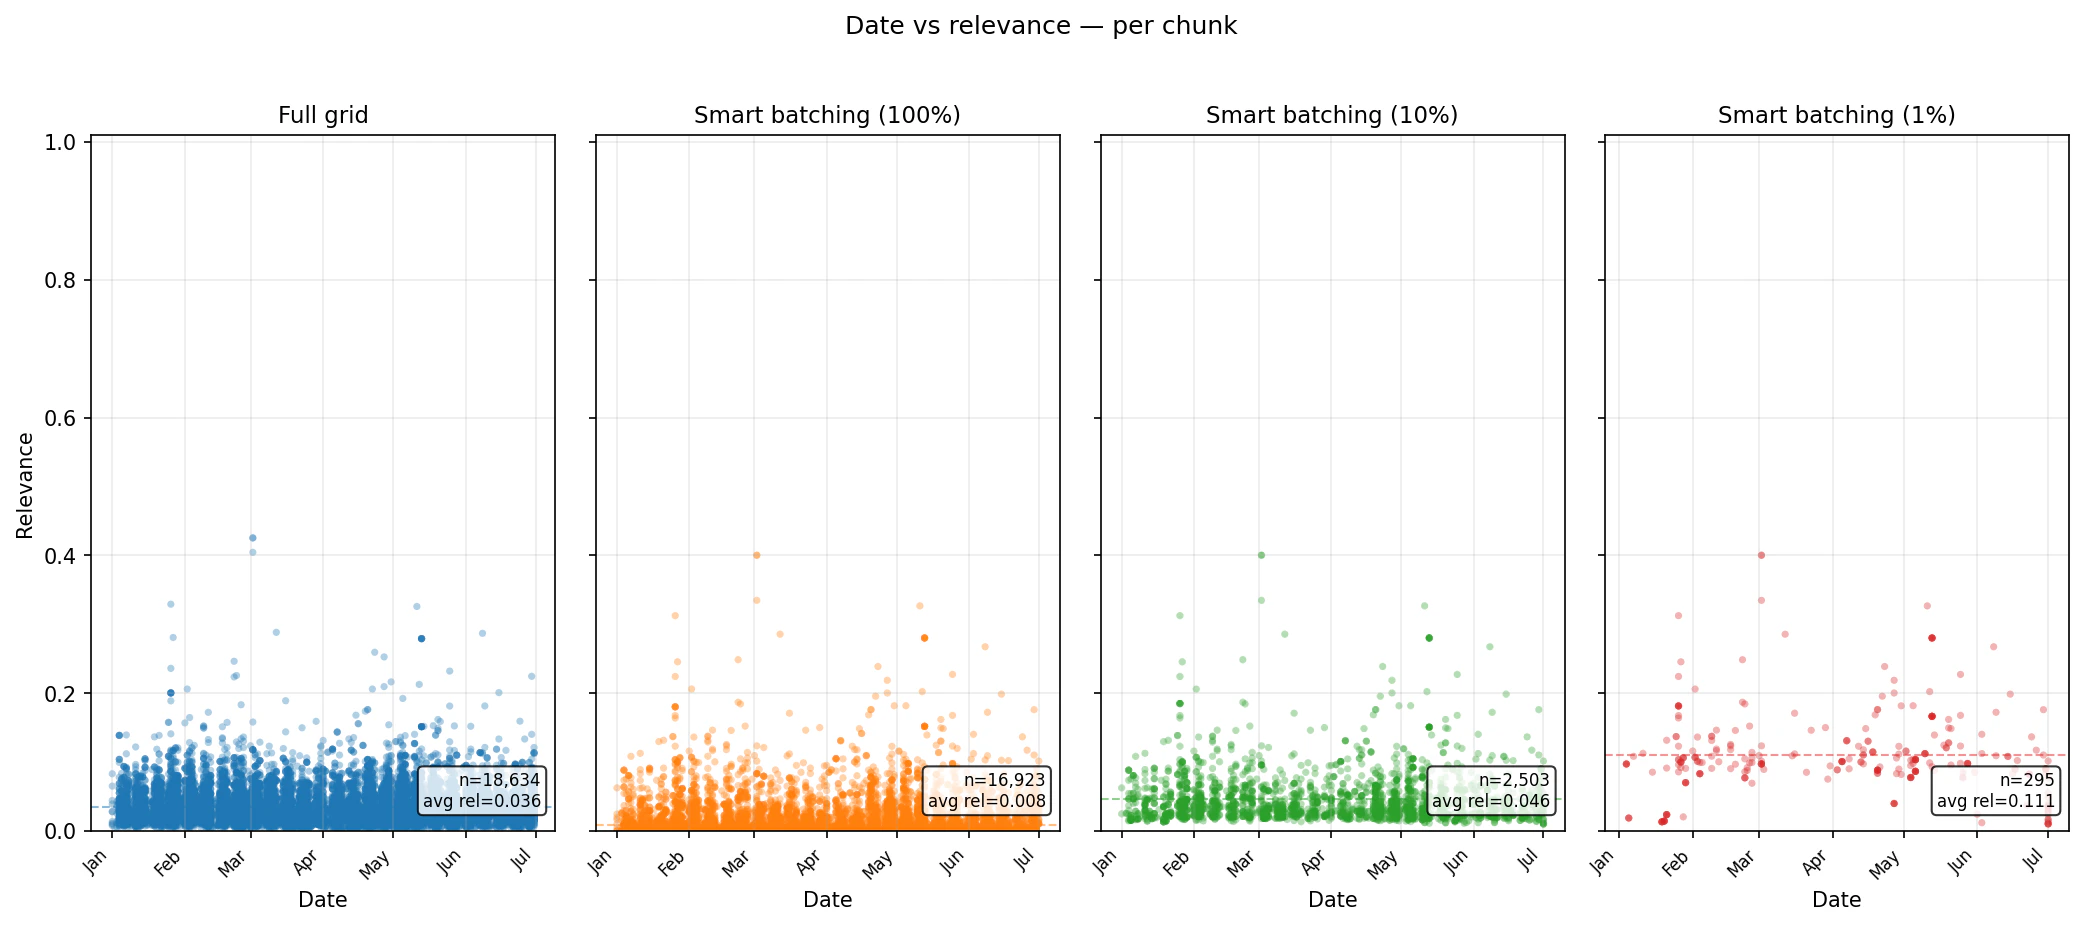
Runtime alone is not enough. The real question is what kind of evidence remains in the result set. The scatter plots below show per-chunk relevance over time for each benchmark. The important pattern is that lowerchunk_percentage settings reduce the volume of returned chunks and concentrate the output into higher-ranked material. At the same time, Smart Batching still samples through the planned baskets, so the result is not simply one global top-N list.
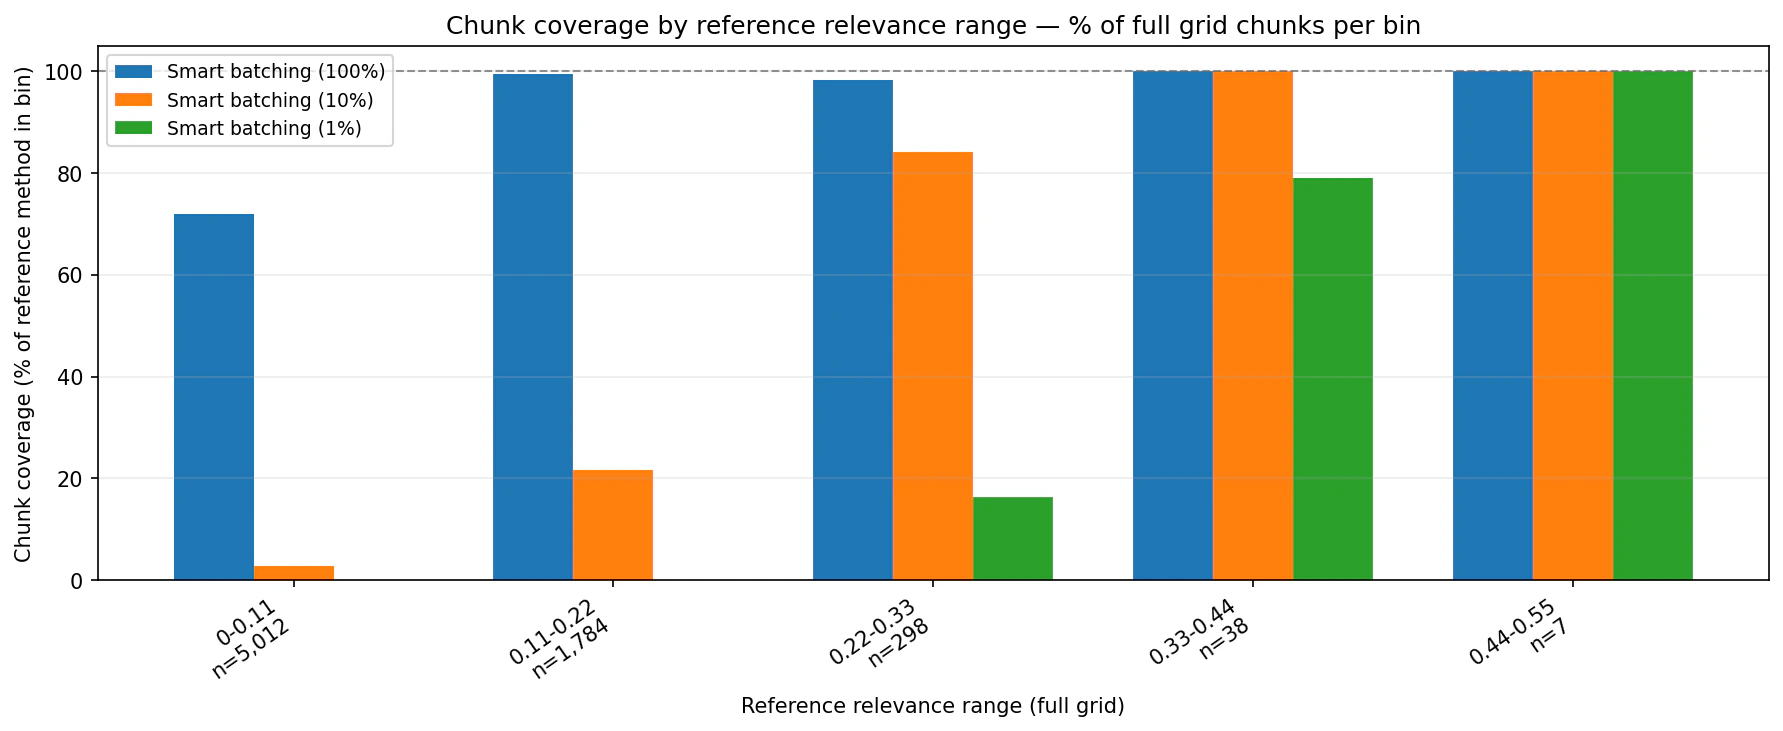
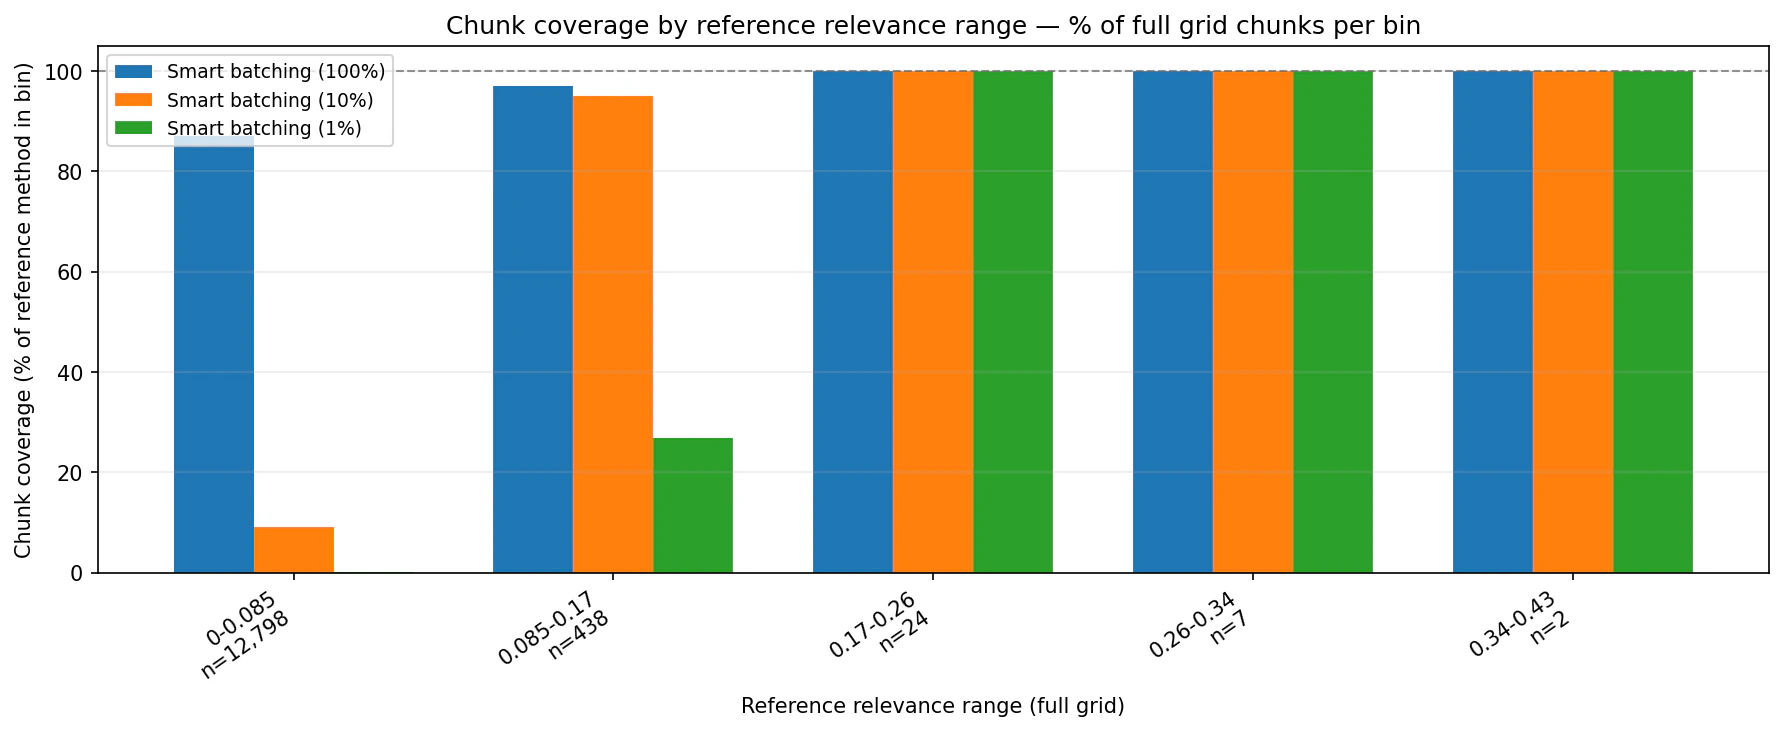
Coverage: What You Keep
The coverage charts compare Smart Batching against the full-grid reference by relevance bin. They show how much of each reference bin appears in the Smart Batching output.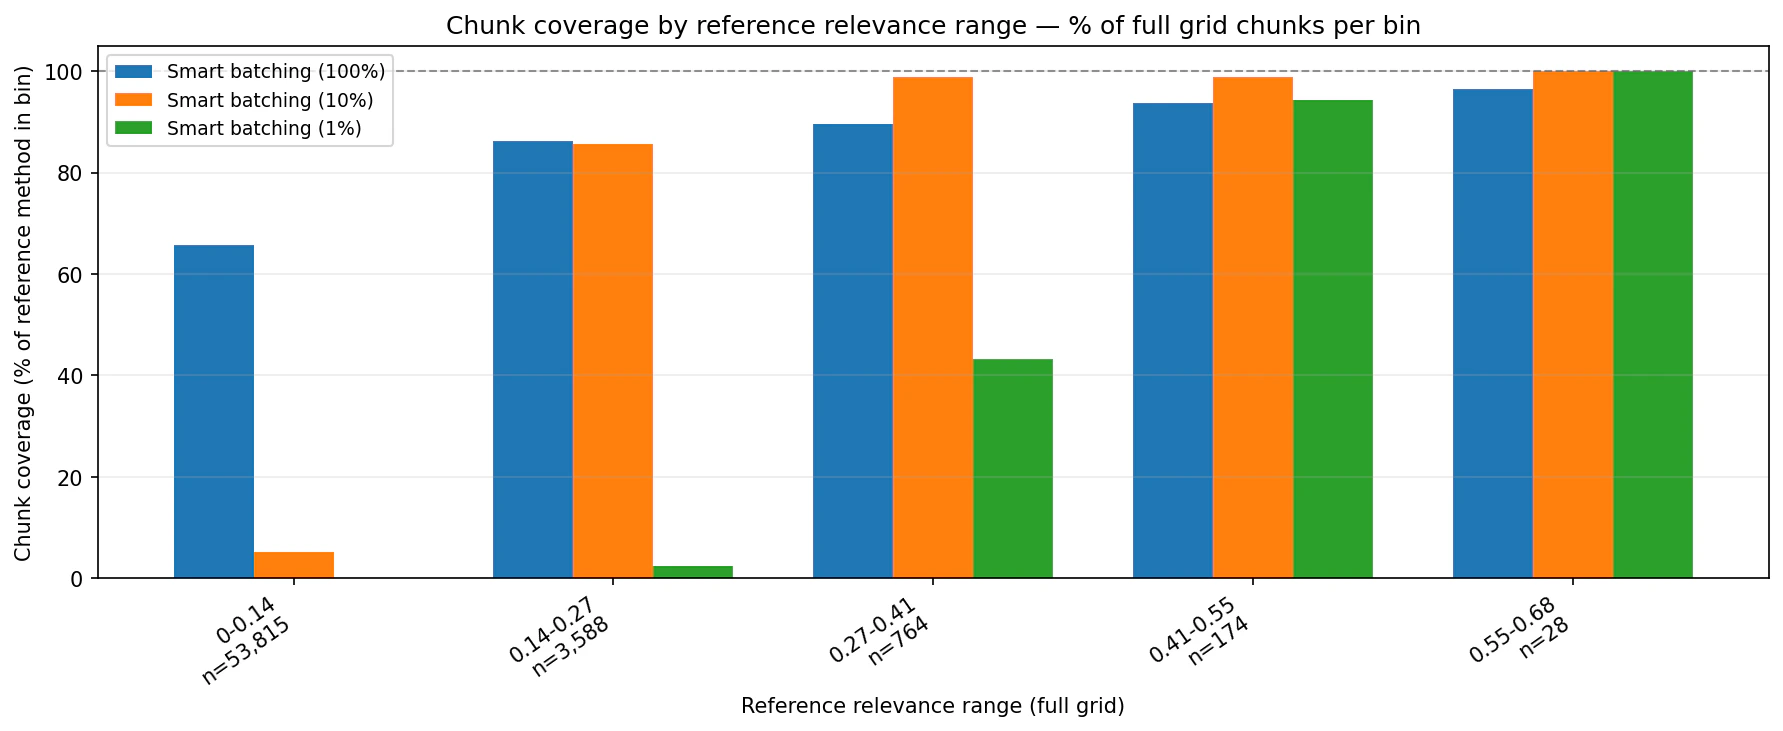
Choosing a budget
The bestchunk_percentage depends on what happens downstream.
Use 1% when the output feeds a human triage queue, alerting workflow, or LLM verification step and the goal is to start with the highest-conviction evidence.
Use 10% when you are building entity-level scores, dashboards, or time-series views and want a stronger balance between speed, relevance, and coverage.
Use 100% when completeness matters and you still want the operational benefit of planned grouping and volume-aware splitting.
Get Started
The full implementation is available in the Smart Batching folder of the Bigdata.com cookbook repository, including the technical notebook. The reusable Python library is published on PyPI asbigdata-smart-batching.
The notebook walks through environment setup, planning, execution, deduplication, plan persistence, and DataFrame conversion using the bigdata-smart-batching Python package. If you are integrating it into your own project, install it with uv add bigdata-smart-batching.
For teams already running large Search workflows on Bigdata.com, Smart Batching is a drop-in pattern for making those workflows more predictable: plan first, choose a budget, execute only what the research task requires, and keep the result grounded in Bigdata.com Search.
This content is for informational purposes only and does not constitute investment advice.
Alberto Martinez
Senior Data Engineer
Francisco Gomez
Manager of Applied Intelligence (VP)