Why It Matters
Technology companies face an increasingly complex regulatory landscape spanning AI governance, data privacy, antitrust scrutiny, and platform accountability. Tracking compliance risks across multiple companies and jurisdictions manually is time-consuming and fragmented, while regulatory developments appear scattered across news coverage, SEC filings, and earnings transcripts.What It Does
TheGenerateReport class in the bigdata-research-tools package systematically analyzes regulatory exposure across company watchlists using unstructured data from news, filings, and transcripts. Built for risk managers and investment professionals, it transforms scattered regulatory information into quantifiable risk intelligence and identifies proactive company mitigation strategies.
How It Works
TheGenerateReport combines automated theme taxonomies, multi-source content retrieval, and LLM-powered risk scoring to deliver:
- Sector-wide regulatory mapping across technology domains (AI, Social Media, Hardware & Chips, E-commerce, Advertising)
- Company-specific risk quantification using Media Attention, Risk/Financial Impact, and Uncertainty metrics
- Mitigation strategy extraction from corporate communications to identify compliance approaches
- Structured output for reporting ranking regulatory issues by intensity and business impact
A Real-World Use Case
This cookbook demonstrates the complete workflow through analyzing regulatory challenges across the “Magnificent 7” tech companies, showing how the generator automatically creates comprehensive risk assessments and extracts company response strategies from multiple document sources. Ready to get started? Let’s dive in!Prerequisites
To run the Report Generator workflow, you can choose between two options:-
💻 GitHub cookbook
- Use this if you prefer working locally or in a custom environment.
- Follow the setup and execution instructions in the
README.md. - API keys are required:
- Option 1: Follow the key setup process described in the
README.md - Option 2: Refer to this guide: How to initialise environment variables
- ❗ When using this method, you must manually add the OpenAI API key:
- ❗ When using this method, you must manually add the OpenAI API key:
- Option 1: Follow the key setup process described in the
-
🐳 Docker Installation
- Docker installation is available for containerized deployment.
- Provides an alternative setup method with containerized deployment, simplifying the environment configuration for those preferring Docker-based solutions.
Setup and Imports
Below is the Python code required for setting up our environment and importing necessary libraries.Defining the Report Parameters
Fixed Parameters
- General Theme (
general_theme): The central regulatory concept to explore across all technology domains - Specific Focus Areas (
list_specific_focus): Technology sectors where regulatory issues are particularly relevant - Bigdata (
bigdata): Bigdata connection
Customizable Parameters
- Watchlist (
my_watchlist_id): The set of companies to analyze. This is the ID of your watchlist in the watchlist section of the app. - Model Selection (
llm_model): The LLM model used to label search result document chunks and generate summaries - Frequency (
search_frequency): The frequency of the date ranges to search over. Supported values:Y: Yearly intervalsM: Monthly intervalsW: Weekly intervalsD: Daily intervals. Defaults to3M
- Time Period (
start_dateandend_date): The date range over which to run the analysis - Fiscal Year (
fiscal_year): If the document type is transcripts or filings, fiscal year needs to be specified - Focus (
focus): Specify a focus within the main theme. This will then be used in building the LLM generated mindmapper - Document Limits (
document_limit_news,document_limit_filings,document_limit_transcripts): The maximum number of documents to return per query to Bigdata API for each category of documents - Batch Size (
batch_size): The number of entities to include in a single batched query
Generate Report
We initialize the class GenerateReport and in the following section of the cookbook, we will go through each step used by this class to generate the report. In the colab cookbook you can skip the step-by-step process and directly run thegenerate_report() method in the section Direct Method.
Mindmap a Theme Taxonomy with Bigdata Research Tools
You can leverage Bigdata Research Tools to generate a comprehensive theme taxonomy with an LLM, breaking down regulatory themes into smaller, well-defined concepts for more targeted analysis across different technology focus areas.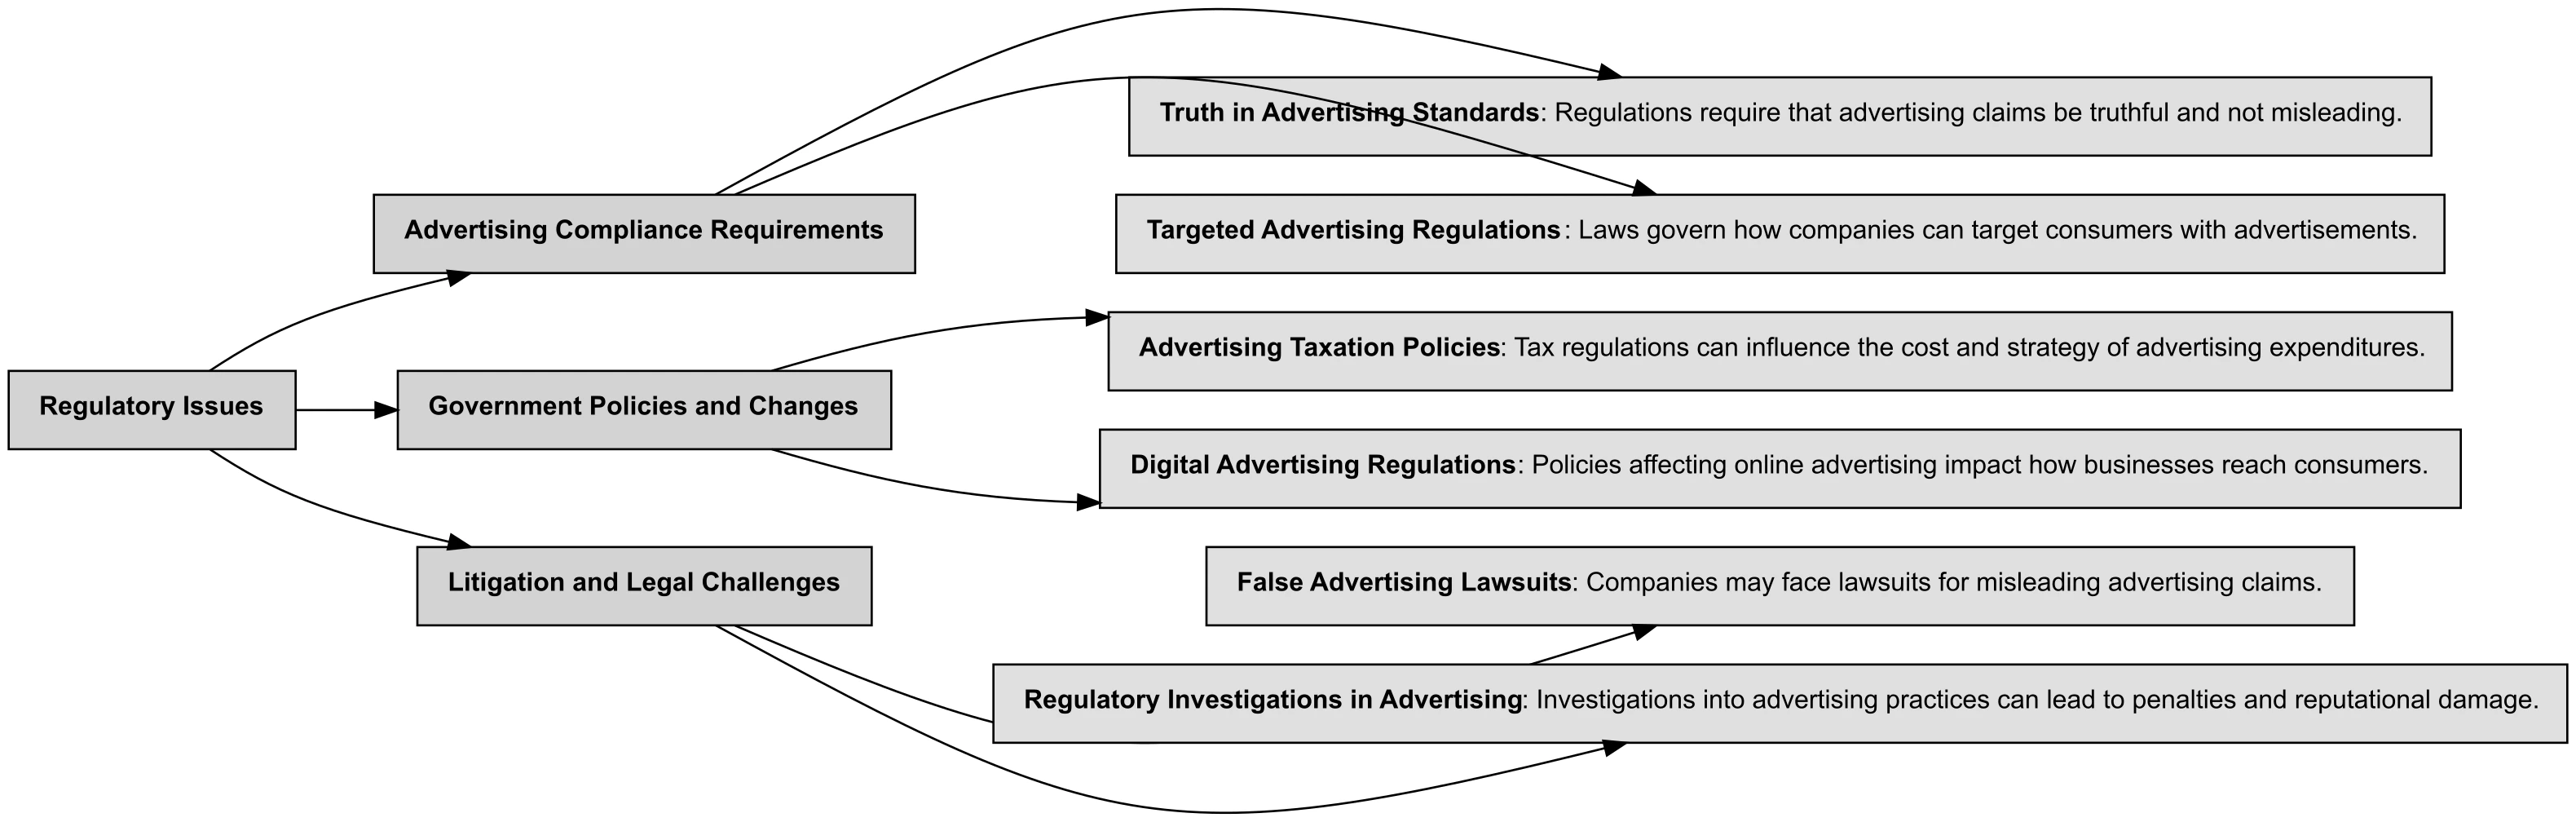
Retrieve Content
With the theme taxonomy and screening parameters, you can leverage the Bigdata API to run searches on company news, filings, and transcripts across different regulatory focus areas.Label the Results
Use an LLM to analyze each document chunk and determine its relevance to the regulatory themes. Any document chunks which aren’t explicitly linked to Regulatory Issues will be filtered out.Document Distribution Visualization
You can visualize the tables showing the count of different document types for each company in the given universe. This helps you understand the distribution and availability of regulatory information across different sources for each entity. Table for All Retrieved Documents about Regulatory Issues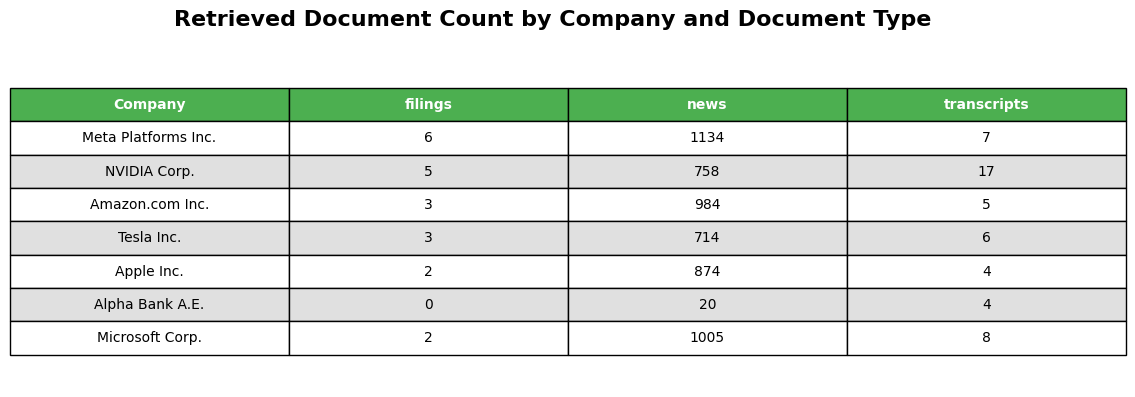

Summarizer
The following code is used to create summaries for regulatory themes at both sector-wide and company-specific levels using the information from the retrieved documents.Company Response Analysis
Extract company mitigation strategies and regulatory responses from filings and transcripts to understand how companies are proactively addressing regulatory challenges.Generate Final Report
The following code provides an example of how the final regulatory issues report can be formatted, ranking topics based on their Media Attention, Risk/Financial Impact, and Uncertainty. You can customize the ranking system by specifying the number of top themes to display withuser_selected_nb_topics_themes.
Report: Regulatory Issues in the Tech Sector
Sector-Wide Issues
Regulatory Issues in AI
Regulatory Issues in AI
Regulatory Investigations of AI Practices
Regulatory Investigations of AI Practices
Regulatory investigations into AI practices are intensifying globally, with significant scrutiny from U.S. and EU authorities targeting major tech firms like OpenAI, Microsoft, and Meta for potential antitrust violations, data misuse, and compliance with new AI regulations. Notably, the EU’s AI Act, effective August 2024, imposes strict risk-based regulations on AI technologies, while the U.S. FTC is investigating partnerships that may hinder competition. Additionally, the Chinese AI startup DeepSeek is under investigation for potential violations of U.S. export restrictions, raising concerns about the integrity of AI supply chains.
Class Action Lawsuits in AI
Class Action Lawsuits in AI
Numerous class action lawsuits have emerged against AI companies like OpenAI and Meta, primarily focusing on allegations of copyright infringement for using copyrighted materials without permission to train AI models. Notable cases include The New York Times’ lawsuit against OpenAI and Microsoft filed in December 2023, and ongoing lawsuits from authors such as Sarah Silverman and Ta-Nehisi Coates against Meta for similar violations. These legal challenges highlight the growing tension between AI development and the rights of content creators, with potential implications for future regulatory frameworks in the AI sector.
Export Restrictions on AI Chips
Export Restrictions on AI Chips
The U.S. tech industry is voicing strong opposition to proposed export restrictions on AI chips, warning that such regulations could undermine American leadership in AI and benefit international competitors, particularly China. The Biden administration’s recent measures aim to limit access to advanced AI technologies for adversarial nations, with significant implications for major companies like Nvidia, Microsoft, and Amazon, who face compliance challenges and potential revenue losses. As of early 2024, these export controls are expected to reshape the global tech landscape, with ongoing debates about their effectiveness and impact on U.S. economic interests.
Regulatory Issues in Advertising
Regulatory Issues in Advertising
Regulatory Investigations
Regulatory Investigations
Regulatory investigations into major tech companies, particularly those involving Elon Musk’s businesses, are intensifying, with at least 20 ongoing federal probes into Tesla and SpaceX as of late 2024. Concurrently, the EU is actively pursuing investigations against Apple, Meta, and Google under the Digital Markets Act, with potential fines reaching up to 10% of global revenues, while the U.S. FTC is also scrutinizing Amazon and Microsoft for antitrust violations. These regulatory actions reflect a broader trend of increased oversight on tech giants, particularly in relation to data privacy, competition, and advertising practices.
Class Action Lawsuits
Class Action Lawsuits
Recent class action lawsuits highlight significant regulatory issues in advertising, particularly concerning privacy violations and misleading claims. Notably, Apple settled a 7 billion. Additionally, Amazon is embroiled in multiple lawsuits for unlawfully collecting geolocation data and misleading consumers about the environmental impact of its products.
Truth in Advertising
Truth in Advertising
Recent reports highlight significant regulatory issues in advertising, particularly concerning misleading claims and consumer protection. Notably, Apple faces lawsuits for allegedly deceptive marketing of its ‘carbon neutral’ Apple Watches and misleading advertisements regarding its AI capabilities, while Meta is scrutinized for promoting illegal products and failing to curb scam ads on its platforms. Additionally, Amazon is challenged over greenwashing allegations related to its paper products and the sale of items to minors, emphasizing the need for transparency and compliance in advertising practices.
Regulatory Issues in E-commerce
Regulatory Issues in E-commerce
E-commerce Trade Regulations
E-commerce Trade Regulations
Recent reports highlight significant regulatory challenges facing e-commerce giants like Amazon and Flipkart, particularly regarding antitrust lawsuits and compliance with new trade tariffs. In India, investigations revealed that both companies favored select sellers, prompting legal actions and potential changes in marketplace regulations. Additionally, U.S. tariffs on imports, including those from China, are expected to impact Amazon’s supply chain and pricing strategies, with analysts noting that about 25% of its goods sold are sourced from China, raising concerns about increased operational costs and competitive dynamics.
E-commerce Legal Penalties
E-commerce Legal Penalties
E-commerce companies, particularly major tech firms like Apple, Meta, and Google, face significant legal penalties for regulatory violations in the EU, with fines potentially reaching up to 10% of their global revenue under the Digital Markets Act (DMA) and Digital Services Act (DSA). Recent reports indicate that Apple was fined EUR 1.8 billion for anti-competitive practices, while Meta has incurred over EUR 2 billion in GDPR fines since 2022. Additionally, the Delhi High Court imposed a USD 39 million penalty on Amazon for trademark infringement, highlighting the increasing scrutiny and legal challenges faced by e-commerce platforms globally.
E-commerce Taxation Policies
E-commerce Taxation Policies
E-commerce taxation policies are increasingly complex, with various jurisdictions implementing digital service taxes targeting major tech companies like Amazon and Google, as seen in Canada’s retroactive tax effective from 2022, expected to generate $7.2 billion over five years. Additionally, the IRS is tightening regulations on online sales reporting, particularly affecting platforms like eBay and Facebook Marketplace, while countries like India are scrapping digital taxes to ease trade tensions with the U.S. These developments highlight the ongoing regulatory challenges and compliance requirements faced by e-commerce businesses globally.
Company-Specific Issues
Amazon.com Inc.
Amazon.com Inc.
Most Reported Issue
Most Reported Issue
Regulatory Issues in E-commerce - E-commerce Trade Regulations:
Amazon.com Inc. faces significant regulatory challenges, including ongoing antitrust lawsuits alleging monopolistic practices in the U.S. and India, scrutiny over compliance with import tariffs and product safety regulations, and potential impacts from new tariffs affecting its supply chain, particularly from China, which could raise operational costs and affect its competitive position in various markets.
Biggest Risk
Biggest Risk
Regulatory Issues in E-commerce - E-commerce Trade Regulations:
Regulatory issues, including antitrust lawsuits and potential tariff impacts, pose significant risks to Amazon.com Inc.’s business model and financial performance, particularly due to its reliance on third-party sellers and international supply chains.
Most Uncertain Issue
Most Uncertain Issue
Regulatory Issues in E-commerce - E-commerce Trade Regulations:
The outcome of Regulatory Issues in E-commerce - E-commerce Trade Regulations on Amazon.com Inc. is highly uncertain due to ongoing antitrust lawsuits, potential changes in tariff policies, and various regulatory challenges across multiple jurisdictions.
Company's Response
Company's Response
Regulatory Issues in E-commerce - E-commerce Trade Regulations: Amazon.com Inc. is actively addressing regulatory challenges by establishing contractual relationships with local entities in China to comply with foreign investment and cybersecurity regulations, providing marketing and logistics support to third-party sellers in India to navigate ownership restrictions, and vigorously defending against antitrust lawsuits filed by the Federal Trade Commission and state Attorneys General, including ongoing litigation in the W.D. Wash. and the DC Court of Appeals as of September and August 2024, respectively.
Apple Inc.
Apple Inc.
Most Reported Issue
Most Reported Issue
Regulatory Issues in Social Media - Social Media Regulations:
Apple Inc. is facing significant regulatory challenges related to its App Tracking Transparency (ATT) framework, which has drawn scrutiny from various authorities, including a €150 million fine from France for allegedly abusing its dominant position in the mobile apps market, and ongoing investigations in Germany and Brazil, while also navigating new age verification requirements and compliance with the EU’s Digital Markets Act aimed at promoting competition.
Biggest Risk
Biggest Risk
Regulatory Issues in Social Media - Social Media Regulations:
Regulatory issues in social media, particularly concerning Apple’s App Tracking Transparency and antitrust scrutiny in Europe, pose a significant financial risk to Apple Inc., potentially leading to substantial fines and operational changes that could impact its revenue.
Most Uncertain Issue
Most Uncertain Issue
Regulatory Issues in Social Media - Social Media Regulations:
The outcome of Regulatory Issues in Social Media - Social Media Regulations on Apple Inc. is highly uncertain due to ongoing investigations, potential fines, and the evolving regulatory landscape across multiple jurisdictions.
Company's Response
Company's Response
Regulatory Issues in Social Media - Social Media Regulations: Apple Inc. is actively responding to regulatory scrutiny by developing a new ‘Declared Age Range’ API to assist social media apps in age verification while maintaining its commitment to user privacy, despite facing a €150 million fine from France for its App Tracking Transparency (ATT) framework, which has been criticized for creating an uneven competitive landscape; the company has also expressed concerns that the EU’s Digital Markets Act could jeopardize user privacy, indicating a strategic focus on compliance and adaptation to evolving regulations.
Meta Platforms Inc.
Meta Platforms Inc.
Most Reported Issue
Most Reported Issue
Regulatory Issues in Social Media - Social Media Regulations:
Meta Platforms Inc. is facing significant regulatory challenges, including new draft Digital Personal Data Protection rules requiring parental consent for children’s accounts, ongoing scrutiny and fines under the EU’s GDPR totaling $2.67 billion since 2022, and a landmark antitrust trial regarding its acquisitions of Instagram and WhatsApp, all of which could severely impact its business operations and advertising models.
Biggest Risk
Biggest Risk
Regulatory Issues in Social Media - Social Media Regulations:
Regulatory issues in social media, particularly concerning data privacy, content moderation, and compliance with new laws, pose significant financial risks to Meta Platforms Inc., as evidenced by ongoing legal challenges, substantial fines, and the potential for operational changes that could impact its advertising revenue.
Most Uncertain Issue
Most Uncertain Issue
Regulatory Issues in Social Media - Social Media Regulations:
The outcome of Regulatory Issues in Social Media - Social Media Regulations on Meta Platforms Inc. is highly uncertain due to ongoing legal challenges, evolving regulations, and significant scrutiny from various governments and regulatory bodies.
Company's Response
Company's Response
Regulatory Issues in Social Media - Social Media Regulations: Meta Platforms Inc. is actively responding to regulatory challenges by implementing changes to its user data practices, such as transitioning the legal basis for behavioral advertising from ‘legitimate interests’ to ‘consent’ in the EU, offering a ‘subscription for no ads’ alternative since November 2023, and engaging with regulators on compliance with the GDPR and other regulations, while also appealing a EUR 1.2 billion fine imposed by the IDPC for non-compliance with data transfer regulations.
- Most Reported Issue: The regulatory topic receiving the highest volume of media coverage
- Biggest Risk: The regulatory issue with the highest potential financial and business impact
- Most Uncertain Issue: The regulatory matter with the greatest ambiguity and unpredictability
Export the Results
Export the data as Excel files for further analysis or to share with the team.Conclusion
The Regulatory Issues Report Generator provides a comprehensive automated framework for analyzing regulatory risks and company mitigation strategies across the technology sector. By systematically combining advanced information retrieval with LLM-powered analysis, this workflow transforms unstructured regulatory information into structured, decision-ready intelligence. Through the automated analysis of regulatory challenges across multiple technology domains, you can:- Analyze regulatory intensity - Compare regulatory scrutiny levels across different technology sectors (AI, Social Media, Hardware & Chips, E-commerce, Advertising) to identify compliance challenges
- Assess company-specific risk profiles - Compare how companies within your watchlist are exposed to different regulatory issues using quantitative scoring across Media Attention, Risk/Financial Impact, and Uncertainty dimensions
- Monitor proactive compliance strategies - Track how companies are responding to regulatory challenges through their filings, transcripts, and public communications, identifying best practices and strategic approaches
- Quantify regulatory uncertainty - The comprehensive scoring system provides clear metrics to identify which regulatory issues pose the greatest ambiguity and unpredictability for strategic planning
- Generate sector-wide intelligence - Create comprehensive reports that inform regulatory strategy, compliance planning, and investment decisions across technology companies
- Analyze regulatory landscape for specific periods - Generate comprehensive snapshots of regulatory challenges and company responses for defined time periods, enabling informed risk assessment and strategic planning