Why It Matters
Understanding how market narratives emerge and evolve across different information sources is crucial for investment decision-making, but manually tracking narrative development across scattered news coverage, earnings calls, and regulatory filings is time consuming. Investment decisions need systematic analysis of narrative progression to identify emerging trends and timing patterns.What It Does
TheNarrativeMiner class in the bigdata-research-tools package systematically tracks narrative evolution across multiple document types using unstructured data from news, transcripts, and filings. Built for analysts and investment professionals, it transforms scattered narrative signals into quantified trend intelligence and identifies timing patterns across different information sources.
How It Works
TheNarrativeMiner combines multi-source content retrieval, temporal narrative tracking, and cross-source comparative analysis to deliver:
- Cross-document narrative mapping across news media, earnings calls, and SEC filings
- Temporal evolution tracking showing how narratives develop and change over time across sources
- Intensity measurement quantifying narrative prevalence and significance across document types
A Real-World Use Case
This cookbook demonstrates the complete workflow through analyzing “AI Bubble Concerns” narrative as it emerges and evolves across news, earnings calls, and regulatory filings, highlighting the difference between public discourse and corporate communications. Ready to get started? Let’s dive in!Prerequisites
To run the Narrative Miner workflow, you can choose between two options:-
💻 GitHub cookbook
- Use this if you prefer working locally or in a custom environment.
- Follow the setup and execution instructions in the
README.md. - API keys are required:
- Option 1: Follow the key setup process described in the
README.md - Option 2: Refer to this guide: How to initialise environment variables
- ❗ When using this method, you must manually add the OpenAI API key:
- ❗ When using this method, you must manually add the OpenAI API key:
- Option 1: Follow the key setup process described in the
-
🐳 Docker Installation
- Docker installation is available for containerized deployment.
- Provides an alternative setup method with containerized deployment, simplifying the environment configuration for those preferring Docker-based solutions.
Setup and Imports
Below is the Python code required for setting up our environment and importing necessary libraries.Defining the Narrative Analysis Parameters
- AI Bubble Narratives (
main_narratives): Specific narrative sentences related to AI bubble concerns - Model Selection (
llm_model): The LLM model used to label search result document chunks and generate summaries - Time Period (
start_dateandend_date): The date range over which to run the analysis - Rerank Threshold (
rerank_threshold): By setting this value, you’re enabling the cross-encoder which reranks the results and selects those whose relevance is above the percentile you specify (0.7 being the 70th percentile). More information on the re-ranker can be found here. - Document Limit (
document_limit): The maximum number of documents to return per query to Bigdata API. - Fiscal Year (
fiscal_year): If the document type is transcripts or filings, fiscal year needs to be specified - Frequency (
freq): The frequency of the date ranges to search over. Supported values:Y: Yearly intervals.M: Monthly intervals.W: Weekly intervals.D: Daily intervals.
Configure the Narrative Miners
Create narrative miners for each document type. In this example, we select MT Newswires as the news source for focused analysis.Run Narrative Mining Across Sources
Execute the narrative mining processes for news, earnings call transcripts, and SEC filings. Each miner independently analyzes its document type for the specified narratives.Load and Process Results
Load the exported Excel files, clean the data, and display a comprehensive summary of narrative findings across all document sources.Create Narrative Visualizations
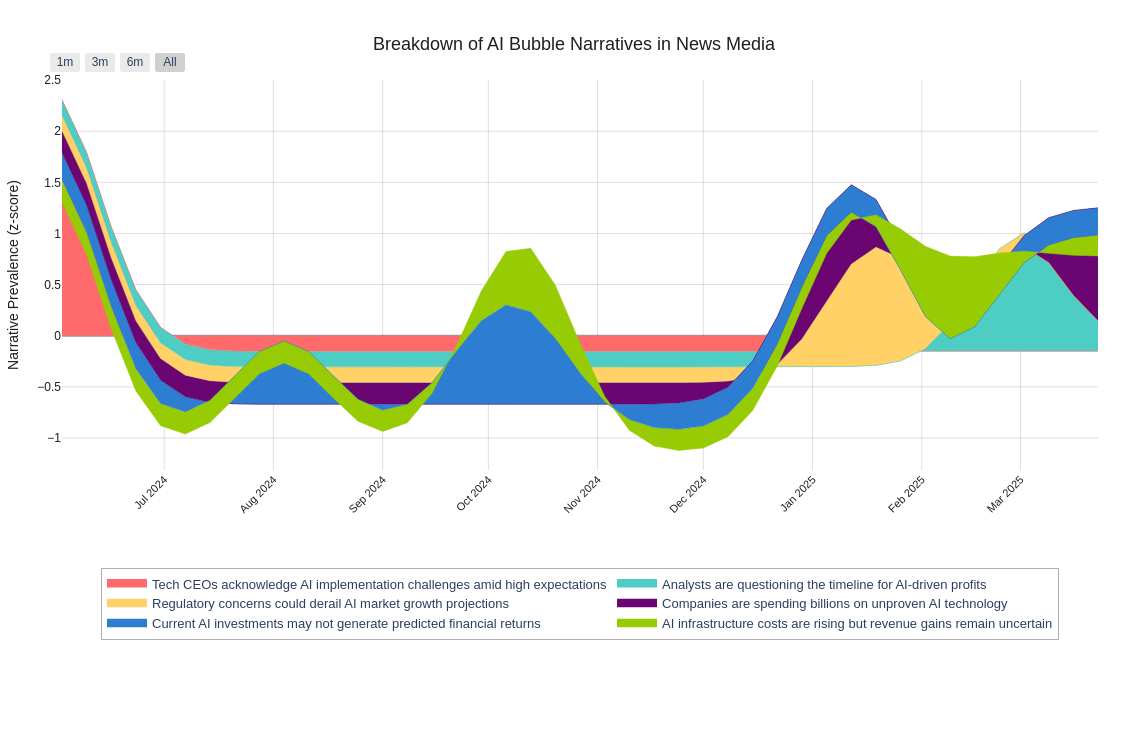
Generate comparative visualizations showing narrative evolution across sources and detailed breakdown of news narratives. These visualizations reveal timing patterns and intensity variations across different information channels.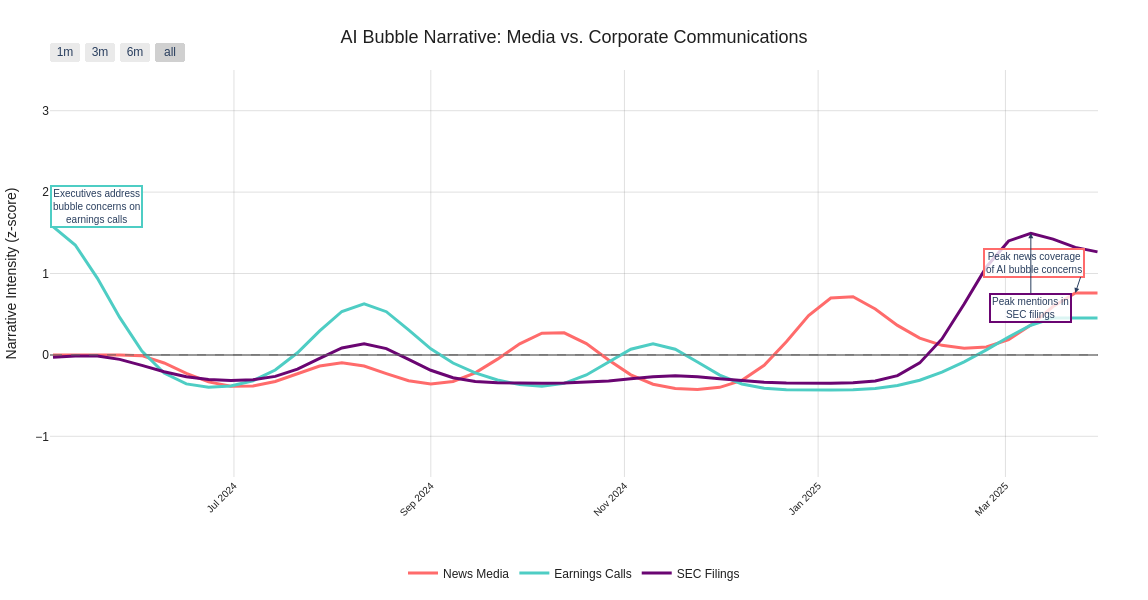
Extract and Display Key Insights
Extract key insights from the narrative mining data to understand narrative progression patterns and cross-source relationships.AI Bubble Narrative Key Insights
- Peak month for news coverage: January 2025
- Peak month for earnings call mentions: May 2024
- Peak month for regulatory filing mentions: March 2025
- Dominant narrative in news: “Companies are spending billions on unproven AI technology”
- Dominant narrative in earnings calls: “Tech CEOs acknowledge AI implementation challenges amid high expectations”
- Dominant narrative in regulatory filings: “Current AI investments may not generate predicted financial returns”
- Total narrative mentions in news: 115
- Total mentions in earnings calls: 352
- Total mentions in regulatory filings: 2440
Average lag between news coverage peaks and SEC filings: 32 days
Key Narrative Patterns Revealed
The analysis reveals important patterns in how the AI bubble narrative evolved across information sources:Timing and Intensity Variations
- News media shows major spikes in AI bubble concerns, often leading the narrative cycle with the highest peaks
- Earnings calls demonstrate cyclical attention to bubble concerns, with executives addressing topics most prominently during specific quarters
- SEC filings show the most volatile pattern with multiple significant spikes, suggesting ongoing regulatory concerns
Narrative Progression
- Media coverage often leads the initial bubble narrative, potentially triggering corporate responses visible in earnings calls
- Corporate executives’ discussions peak during specific periods but tend to diminish over time
- SEC filing mentions frequently show increased intensity throughout the analysis period, indicating persistent regulatory attention
Cross-Source Intelligence
- Different sources provide complementary perspectives on the same underlying narrative
- Timing lags between sources reveal information flow patterns and decision-making hierarchies
- The intensity patterns help identify when narratives are gaining or losing momentum across different stakeholder groups
Export the Results
Export the data as Excel files for further analysis or to share with the team.Conclusion
TheNarrativeMiners provide a comprehensive automated framework for tracking narrative evolution across multiple information sources simultaneously. By systematically combining advanced information retrieval with temporal analysis, this workflow transforms scattered narrative signals into structured intelligence for strategic decision-making.
Through the automated analysis of AI bubble concerns across news, earnings calls, and regulatory filings, you can:
- Identify narrative emergence patterns - Discover how market narratives first appear and which sources tend to lead narrative development cycles
- Track cross-source narrative flow - Monitor how narratives propagate from initial media coverage through corporate communications to regulatory attention
- Quantify narrative intensity - Measure the relative importance and persistence of specific narratives across different information channels and time periods
- Detect timing patterns - Identify lead-lag relationships between sources that reveal decision-making hierarchies and information flow patterns
- Monitor narrative evolution - Track how narratives change, intensify, or diminish over time across different stakeholder groups
- Generate comparative intelligence - Create comprehensive reports that reveal which narratives are gaining momentum and where, enabling proactive strategic positioning
NarrativeMiners automate the research process while maintaining the depth required for professional analysis. The cross-source methodology ensures comprehensive coverage of narrative development, making it an invaluable tool for systematic market narrative intelligence in dynamic information environments.
This analysis demonstrates how systematic narrative mining across multiple document types provides richer insights than analyzing any single source in isolation, revealing the complete lifecycle of market narratives from emergence to institutional response.