Why It Matters
The rapid growth of AI and high-performance computing is driving unprecedented energy demands in data centers, making efficient cooling solutions critical for operational sustainability and cost management. Traditional air cooling is reaching its limits, creating opportunities for liquid cooling technology providers and early adoption advantages for data center operators, but tracking these developments across fragmented industry coverage is challenging for investment decisions.What It Does
Using the functions available in thebigdata-research-tools package, you can create a comprehensive liquid cooling ecosystem analysis tool that identifies technology providers, tracks customer adoption patterns, and maps provider-customer relationships using unstructured data from news sources. These functions are suitable for technology analysts, infrastructure investors, and industry professionals to create tools that transform scattered technology signals into quantified market intelligence and identify investment opportunities in the cooling technology value chain.
How It Works
This workflow combines dual-role classification and temporal tracking to deliver:- Provider vs. adopter identification distinguishing companies developing liquid cooling solutions from those implementing them
- Technology ecosystem mapping revealing relationships between solution providers and data center operators
- Adoption timeline tracking showing how liquid cooling implementation evolves across different sectors
- Market positioning analysis quantifying each company’s role and exposure in the liquid cooling ecosystem
A Real-World Use Case
This cookbook demonstrates the complete workflow through analyzing liquid cooling technology dynamics across the data center industry using news data, showing how the system automatically identifies technology leaders, tracks customer adoption patterns, and reveals provider-customer networks through automated relationship analysis. Ready to get started? Let’s dive in!Prerequisites
To run the Liquid Cooling Market Watch workflow, you can choose between two options:-
💻 GitHub cookbook
- Use this if you prefer working locally or in a custom environment.
- Follow the setup and execution instructions in the
README.md. - API keys are required:
- Option 1: Follow the key setup process described in the
README.md - Option 2: Refer to this guide: How to initialise environment variables
- ❗ When using this method, you must manually add the OpenAI API key:
- ❗ When using this method, you must manually add the OpenAI API key:
- Option 1: Follow the key setup process described in the
-
🐳 Docker Installation
- Docker installation is available for containerized deployment.
- Provides an alternative setup method with containerized deployment, simplifying the environment configuration for those preferring Docker-based solutions.
Setup and Imports
Below is the Python code required for setting up our environment and importing necessary libraries.Defining your Liquid Cooling Analysis Parameters
Fixed Parameters
- Provider Theme (
provider_theme): The central concept to explore for liquid cooling technology providers - Adopter Theme (
adopter_theme): The concept to explore for companies adopting liquid cooling in their data centers - Provider Sentences (
provider_sentences_list): Sentences used to identify companies providing liquid cooling solutions - Adopter Sentences (
adopter_sentences_list): Sentences used to identify companies adopting liquid cooling technology - Document Type (
document_type): Specify which documents to search over (transcripts, filings, news)
Customizable Parameters
- Watchlist (
my_watchlist_id): The set of companies to analyze. This is the ID of your watchlist on the watchlist section of the app. If set toNone, each company referenced in the retrieved chunks will be analyzed. - Model Selection (
llm_model): The LLM model used to label search result document chunks and generate summaries - Frequency (
freq): The frequency of the date ranges to search over. Supported values:Y: Yearly intervals.M: Monthly intervals.W: Weekly intervals.D: Daily intervals. Defaults toM.
- Time Period (
start_dateandend_date): The date range over which to run the analysis - Document Sources (
sources): Specify set of sources within a document type, for example which news outlets (available via Bigdata API) you wish to search over - Rerank Threshold (
rerank_threshold): By setting this value, you’re enabling the cross-encoder which reranks the results and selects those whose relevance is above the percentile you specify (0.7 being the 70th percentile). More information on the re-ranker can be found here. - Document Limit (
document_limit): The maximum number of documents to return per query to Bigdata API - Batch Size (
batch_size): The number of entities to include in a single batched query
Retrieve Content using Bigdata’s Search Capabilities
With the liquid cooling narratives and analysis parameters, you can leverage the Bigdata API to run a search on company news for both provider and adopter indicators.Label the Results
Use an LLM to analyze each document chunk and determine its relevance to liquid cooling technology, classifying companies as either providers (P), adopters (A), or unrelated (U).Visualizations
Sector-Based Liquid Cooling Technology Visualization
The following visualizations provide a sector-by-sector breakdown of companies involved in liquid cooling technology. These charts help identify:- Industry Patterns: Which sectors show more liquid cooling activity
- Technology Leaders: Companies most frequently mentioned in liquid cooling contexts within each sector
- Story Context: Detailed hover information reveals the specific headlines, motivations, and news excerpts driving each company’s positioning
Companies Providing Liquid Cooling Solutions
This chart displays companies that have been most frequently mentioned as providers of liquid cooling technology, organized by sector and ranked by total mention volume. The visualization reveals which companies and industries are leading the development and supply of liquid cooling solutions for data centers.Companies Adopting Liquid Cooling Technology
This complementary chart shows companies most frequently mentioned as adopters of liquid cooling technology in their data centers, organized by sector and ranked by total mention volume. It identifies firms investing in liquid cooling infrastructure and implementing new cooling systems.Liquid Cooling Ecosystem Analysis
This comprehensive assessment combines both provider and adopter signals to create a complete picture of the liquid cooling ecosystem. The analysis provides:- Total Exposure: Overall volume of liquid cooling related news coverage for each company
- Role Classification: Relative proportion of provider versus adopter mentions
- Market Positioning: How companies rank in terms of their involvement in the liquid cooling market
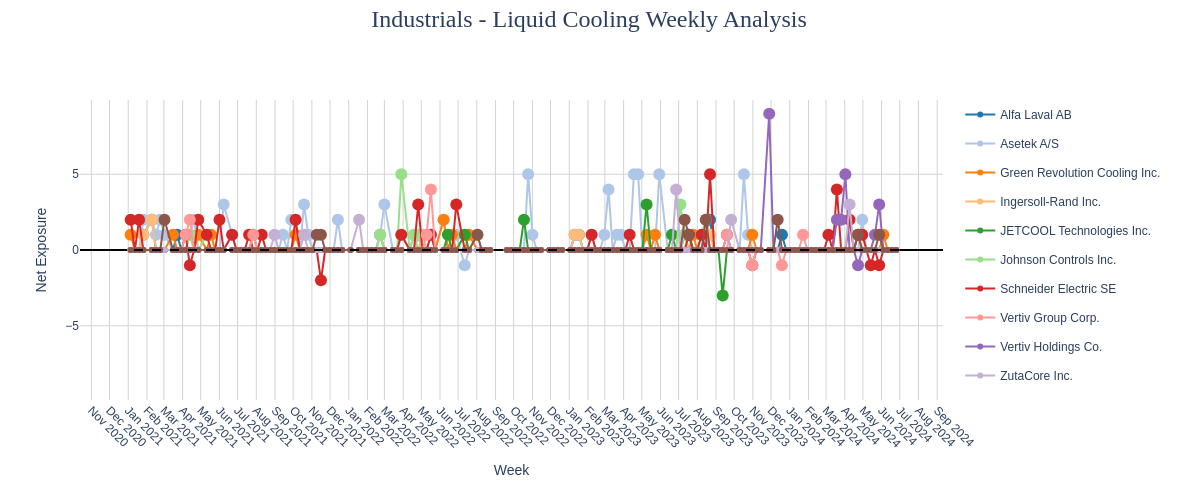
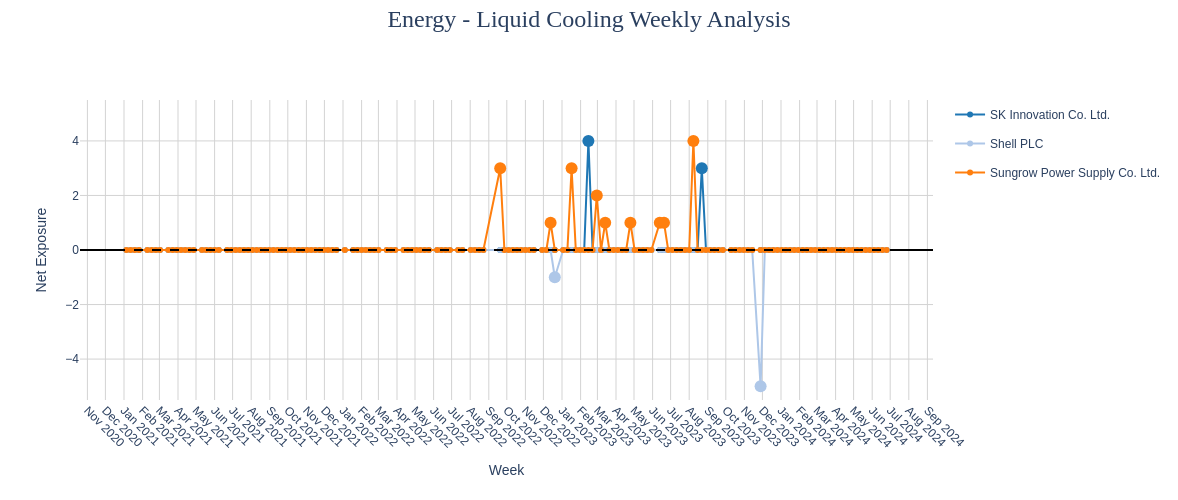
Temporal Liquid Cooling Analysis
This time-series analysis tracks how liquid cooling narratives evolve over time for companies in our ecosystem. The monthly analysis reveals:- Technology Trends: How liquid cooling adoption and development stories develop over time
- Market Evolution: The balance between provider and adopter activities across different periods
Provider-Adopter Network Analysis
This network visualization reveals relationships between liquid cooling technology providers and adopters through co-mentions in news articles. The analysis identifies:- Technology Partnerships: Companies that frequently appear together in liquid cooling contexts
- Customer-Supplier Relationships: Connections between solution providers and data center operators
- Market Clusters: Groups of companies operating in similar segments of the liquid cooling ecosystem
Key Insights and Technology Stories
The liquid cooling analysis reveals several important technology adoption patterns:Technology Provider Leadership
Companies like Dell, NVIDIA, and specialized cooling system manufacturers are leading the development of liquid cooling solutions, with frequent mentions of new product launches and technology partnerships.
Data Center Operator Adoption
Major cloud providers and data center operators are increasingly implementing liquid cooling systems to improve energy efficiency and support high-density computing workloads, particularly for AI and machine learning applications.
Supply Chain Relationships
The network analysis reveals emerging partnerships between cooling technology providers and data center operators, indicating the development of integrated solutions and long-term supply relationships.
Market Evolution
The temporal analysis shows increasing adoption momentum, with more frequent mentions of liquid cooling implementations as organizations seek to address growing energy and performance demands in modern data centers.
Export the Results
Export the data as Excel files for further analysis or to share with the team.Conclusion
The Liquid Cooling Market Watch analysis provides a comprehensive automated framework for analyzing the liquid cooling ecosystem across the data center industry. By systematically combining advanced information retrieval with LLM-powered classification, this workflow transforms unstructured news data into actionable intelligence for strategic decision-making. Through the automated analysis of liquid cooling technology dynamics, you can:- Identify technology leaders - Discover companies developing cutting-edge liquid cooling solutions and those implementing these technologies in their operations
- Map ecosystem relationships - Reveal partnerships and customer-supplier relationships between solution providers and data center operators through network analysis
- Track adoption patterns - Monitor how liquid cooling implementation evolves across different sectors and time periods, identifying emerging trends and market momentum
- Analyze competitive positioning - Compare companies’ roles in the liquid cooling ecosystem, distinguishing between technology developers and end-users
- Monitor technology evolution - Track how liquid cooling narratives develop over time, identifying shifts in market leadership and adoption patterns