Why It Matters

A company’s ability to control prices is a crucial indicator of competitive moat and market position, but systematically evaluating pricing power across scattered news coverage, earnings calls, and filings is resource-intensive and inefficient. Investment decisions need systematic analysis of pricing dynamics to identify companies with sustainable competitive advantages.

What It Does

Using the functions available in the bigdata-research-tools package, you can create a comprehensive pricing power analysis tool that assesses competitive positioning across company watchlists using unstructured data from news sources. These functions are suitable for analysts, portfolio managers, and investment professionals to create tools that transform scattered pricing signals into quantified competitive intelligence and identify investment opportunities based on sustainable pricing advantages.

How It Works

This workflow combines dual-theme sentiment analysis, temporal tracking, and confidence-based scoring to deliver:

  • Positive vs. negative pricing power assessment measuring both pricing strength and competitive pressure signals
  • Sector-wide comparative analysis revealing industry patterns and competitive positioning dynamics
  • Temporal evolution tracking showing how pricing narratives develop and change over time
  • Confidence scoring system quantifying the balance between positive and negative pricing power mentions

A Real-World Use Case

This cookbook demonstrates the complete workflow through analyzing pricing power dynamics across a company watchlist using news data, showing how the miner automatically identifies pricing leaders, tracks competitive positioning changes over time, and reveals sector-specific pricing patterns through automated narrative analysis.

Ready to get started? Let’s dive in!

Open in GitHub

Setup and Imports

Below is the Python code required for setting up our environment and importing necessary libraries.

import os
from logging import Logger, getLogger
from typing import Dict, List, Optional

import matplotlib.gridspec as gridspec
import matplotlib.pyplot as plt
import matplotlib.colors as mcolors
from matplotlib.colors import LinearSegmentedColormap
import numpy as np
import pandas as pd
from pandas import DataFrame, merge
import seaborn as sns

from src.tool import plot_top_companies_by_sector, identify_basket_and_plot_confidence, analyze_basket_weekly_with_labels

from bigdata_client import Bigdata
from bigdata_client.models.entities import Company
from bigdata_client.models.search import DocumentType

from bigdata_research_tools.labeler.screener_labeler import ScreenerLabeler
from bigdata_research_tools.search.screener_search import search_by_companies
from bigdata_research_tools.excel import ExcelManager

# Setup for Plotly in Colab
import plotly.offline as pyo
from plotly.subplots import make_subplots
import plotly
import plotly.io as pio
import plotly.graph_objects as go

# Enable offline mode for Colab
pyo.init_notebook_mode(connected=True)

# Set renderer
pio.renderers.default = 'colab'


# Define output file paths for our results
output_dir = "output"
os.makedirs(output_dir, exist_ok=True)

export_path = f"{output_dir}/pricing_power_analysis_results.xlsx"

Load Environment Variables

The Pricing Power Analysis requires API credentials for both the Bigdata API and the LLM API (in this case, OpenAI). Make sure you have these credentials available as environment variables or in a secure credential store.

Never hardcode credentials directly in your notebook or scripts.

# Secure way to access credentials
from google.colab import userdata

BIGDATA_USERNAME = userdata.get('BIGDATA_USERNAME')
BIGDATA_PASSWORD = userdata.get('BIGDATA_PASSWORD')

# Set environment variables for any new client instances
os.environ["BIGDATA_USERNAME"] = BIGDATA_USERNAME
os.environ["BIGDATA_PASSWORD"] = BIGDATA_PASSWORD

# Use them in your code
bigdata = Bigdata(BIGDATA_USERNAME, BIGDATA_PASSWORD)

OPENAI_API_KEY = userdata.get('OPENAI_API_KEY')
os.environ["OPENAI_API_KEY"] = OPENAI_API_KEY

Defining your Pricing Power Analysis Parameters

Fixed Parameters

  • Pricing Power Theme (pricing_power_theme): The central concept to explore for positive pricing power
  • Lack of Pricing Power Theme (no_pricing_power_theme): The concept to explore for negative pricing power
  • Pricing Power Sentences (pricing_power_sentences_list): Sentences used to improve the retrieval regarding the Pricing Power theme
  • Lacking of Pricing Power Sentences (no_pricing_power_sentences_list): Sentences used to improve the retrieval regarding the Lack of Pricing Power theme
  • Pricing Power Labels (pricing_power_labels_list): Labels used to recognize relevant document chunks for the Pricing Power theme
  • Lacking of Pricing Power Labels (no_pricing_power_labels_list): Labels used to recognize relevant document chunks for the Lack of Pricing Power theme
  • Document Type (document_type): Specify which documents to search over (transcripts, filings, news)
# ===== Fixed Parameters =====

# Pricing Power Theme
pricing_power_theme = "Examples of pricing power for a company"

# Lack of Pricing Power Theme
no_pricing_power_theme = "Examples of lack of pricing power for a company"

# Sentences expressing positive pricing power narratives
pricing_power_sentences_list = [
    'Company has significant pricing power',
    'Firm can set higher prices without losing customers',
    'Organization can set prices above competitors',
    'Corporation can increase prices without affecting sales',
    'Firm can implement price hikes without losing clientele',
    'Business has the ability to control prices',
    'Enterprise can leverage pricing power',
    'Enterprise can sustain higher prices',
    'Business can charge premium prices',
    'Corporation can maintain high prices without losing customers',
    'Business can increase prices without affecting sales',
    'Company can elevate prices without a drop in demand',
    'Enterprise can adjust prices without losing market share',
    'Company can implement price hikes successfully',
    'Firm can raise prices without reducing demand',
    'Corporation can set prices independently',
    'Company can dictate prices in the market',
    'Company can manage prices without losing clients',
    'Organization can increase costs without reducing sales volume',
    'Organization can increase prices without customer backlash',
    'Corporation has the ability to set higher prices',
    'Business can set premium prices without losing customers',
    'Firm has the power to influence prices',
    'Business can control pricing strategy effectively',
    'Enterprise can adjust prices upwards without losing market share',
    'Organization can raise prices without demand impact',
    'Firm can adjust pricing without negative impact'
]

# Sentences expressing lack of pricing power narratives
no_pricing_power_sentences_list = [
    'Company has no pricing power',
    'Firm cannot set higher prices without losing customers',
    'Organization cannot set prices above competitors',
    'Corporation cannot increase prices without affecting sales',
    'Firm cannot implement price hikes without losing clientele',
    'Business lacks the ability to control prices',
    'Enterprise cannot leverage pricing power',
    'Enterprise cannot sustain higher prices',
    'Business cannot charge premium prices',
    'Corporation cannot maintain high prices without losing customers',
    'Business cannot increase prices without affecting sales',
    'Company cannot elevate prices without a drop in demand',
    'Enterprise cannot adjust prices without losing market share',
    'Company cannot implement price hikes successfully',
    'Firm cannot raise prices without reducing demand',
    'Corporation cannot set prices independently',
    'Company cannot dictate prices in the market',
    'Company cannot manage prices without losing clients',
    'Organization cannot increase costs without reducing sales volume',
    'Organization cannot increase prices without customer backlash',
    'Corporation has no ability to set higher prices',
    'Business cannot set premium prices without losing customers',
    'Firm has no power to influence prices',
    'Business cannot control pricing strategy effectively',
    'Enterprise cannot adjust prices upwards without losing market share',
    'Organization cannot raise prices without demand impact',
    'Firm cannot adjust pricing without negative impact'
]

# Labels to categorize pricing power related sentences
pricing_power_labels_list = [
    "Successful Price Increase",
    "Strong Brand Recognition",
    "Launch of Differentiated Product",
    "Customer Loyalty Confirmed",
    "Effective Cost Pass-Through",
    "Competitor Price Follow",
    "High Demand Despite Price Hike",
    "Monopoly or Legal Advantage Maintained",
    "Premium Market Position Reinforced",
    "Switching Costs Recognized by Market"
]

# Labels to categorize lack of pricing power related sentences
no_pricing_power_labels_list = [
    "Failed Price Increase",
    "Weak Brand Recognition",
    "Launch of Commoditized Product",
    "Customer Loyalty Lost",
    "Ineffective Cost Pass-Through",
    "Competitor Price Undercut",
    "Demand Drop After Price Hike",
    "Loss of Market Position",
    "Commodity Market Position",
    "Low Switching Costs",
    "Lack of Pricing Power",
    "Weak Pricing Control",
    "Limited Pricing Influence",
    "Poor Pricing Strategy",
    "No Pricing Authority"
]

# Document Configuration
document_type = DocumentType.NEWS

Customizable Parameters

  • Watchlist (my_watchlist_id): The set of companies to analyze. This is the ID of your watchlist in the watchlist section of the app.
  • Model Selection (llm_model): The LLM model used to label search result document chunks and generate summaries
  • Frequency (freq): The frequency of the date ranges to search over. Supported values:
    • Y: Yearly intervals.
    • M: Monthly intervals.
    • W: Weekly intervals.
    • D: Daily intervals. Defaults to 3M.
  • Time Period (start_date and end_date): The date range over which to run the analysis
  • Document Sources (sources): Specify set of sources within a document type, for example which news outlets (available via Bigdata API) you wish to search over
  • Rerank Threshold (rerank_threshold): By setting this value, you’re enabling the cross-encoder which reranks the results and selects those whose relevance is above the percentile you specify (0.7 being the 70th percentile). More information on the re-ranker can be found here.
  • Document Limit (document_limit): The maximum number of documents to return per query to Bigdata API
  • Batch Size (batch_size): The number of entities to include in a single batched query
# ===== Customizable Parameters =====

# Company Universe (from Watchlist)
# We get Top US 100 watchlist from Bigdata.com
my_watchlist_id = "44118802-9104-4265-b97a-2e6d88d74893"
watchlist = bigdata.watchlists.get(my_watchlist_id)
companies = bigdata.knowledge_graph.get_entities(watchlist.items)

# Choose MT Newswires as a news source
sources = bigdata.knowledge_graph.find_sources("MT Newswires")
tech_news_ids = [source.id for source in sources if "MT Newswires" == source.name]

# LLM Specification
llm_model = "openai::gpt-4o-mini"

# Search Frequency
search_frequency='W'

# Enable/Disable Reranker
rerank_threshold = None

# Specify Time Range
start_date = "2024-01-01"
end_date = "2024-06-01"

# Document Limits
document_limit = 10

# Others
batch_size = 10

Retrieve Content using Bigdata’s Search Capabilities

With the pricing power narratives and analysis parameters, you can leverage the Bigdata API to run a search on company news for both positive and negative pricing power indicators.

df_sentences_positive = search_by_companies(
    companies=companies,
    sentences=pricing_power_sentences_list,
    start_date=start_date,
    end_date=end_date,
    scope=document_type,
    sources=tech_news_ids,
    rerank_threshold=rerank_threshold,
    freq=search_frequency,
    document_limit=document_limit,
    batch_size=batch_size,
)

df_sentences_negative = search_by_companies(
    companies=companies,
    sentences=no_pricing_power_sentences_list,
    start_date=start_date,
    end_date=end_date,
    scope=document_type,
    sources=tech_news_ids,
    rerank_threshold=rerank_threshold,
    freq=search_frequency,
    document_limit=document_limit,
    batch_size=batch_size,
)

Label the Results

Use an LLM to analyze each document chunk and determine its relevance to the Pricing Power theme or to the Lack of Pricing Power theme. Any document chunks which aren’t explicitly linked to one of these will be filtered out.

labeler = ScreenerLabeler(llm_model=llm_model)

df_labels_positive = labeler.get_labels(
    main_theme=pricing_power_theme,
    labels=pricing_power_labels_list,
    texts=df_sentences_positive["masked_text"].tolist(),
)

# Merge and process results for positive pricing power
df_positive = merge(df_sentences_positive, df_labels_positive, left_index=True, right_index=True)
df_positive_relevant = labeler.post_process_dataframe(df_positive)

df_labels_negative = labeler.get_labels(
    main_theme=no_pricing_power_theme,
    labels=no_pricing_power_labels_list,
    texts=df_sentences_negative["masked_text"].tolist(),
)

# Merge and process results for negative pricing power
df_negative = merge(df_sentences_negative, df_labels_negative, left_index=True, right_index=True)
df_negative_relevant = labeler.post_process_dataframe(df_negative)

Visualizations

Sector-Based Pricing Power Visualization

The following visualizations provide a sector-by-sector breakdown of companies mentioned in pricing power contexts. These charts help identify:

  • Industry Patterns: Which sectors show more pricing power activity
  • Market Leaders: Companies most frequently mentioned in pricing power contexts within each sector
  • Story Context: Detailed hover information reveals the specific headlines, motivations, and news excerpts driving each company’s positioning

Each bar represents the frequency of pricing power mentions, with hover details providing the underlying news narrative that shaped each company’s pricing power profile.

Companies with Pricing Power

This chart displays companies that have been most frequently mentioned in positive pricing power contexts, organized by sector and ranked by total mention volume. The visualization reveals which companies and industries demonstrate strong ability to control prices, raise prices without losing customers, or maintain premium positioning in their markets.

plot_top_companies_by_sector(df_positive_relevant, min_companies=1, title_suffix="(Pricing Power)")

Companies Lacking Pricing Power

This complementary chart shows companies most frequently mentioned in negative pricing power contexts, organized by sector and ranked by total mention volume. It identifies firms struggling with price competition, facing customer resistance to price increases, or operating in commoditized markets where pricing control is limited.

plot_top_companies_by_sector(df_negative_relevant, min_companies=1, title_suffix="(Lack of Pricing Power)")

Pricing Power Confidence Analysis

This comprehensive assessment combines both positive and negative pricing power signals to create a confidence-based ranking system. The analysis provides:

  • Total Exposure: Overall volume of pricing power related news coverage for each company
  • Confidence Scoring: Relative proportion of positive versus negative pricing power mentions
  • Relative Ranking: How the top 30 most-mentioned companies compare against each other in terms of pricing power signals

The stacked bar chart shows the percentage breakdown of positive (green) versus negative (red) pricing power mentions, with a reference line at 50%. Companies to the right of the line show predominantly positive pricing power signals, while those to the left face more pricing challenges.

companies_basket = identify_basket_and_plot_confidence(df_positive_relevant, df_negative_relevant, basket_size=30, sector_column='Sector')

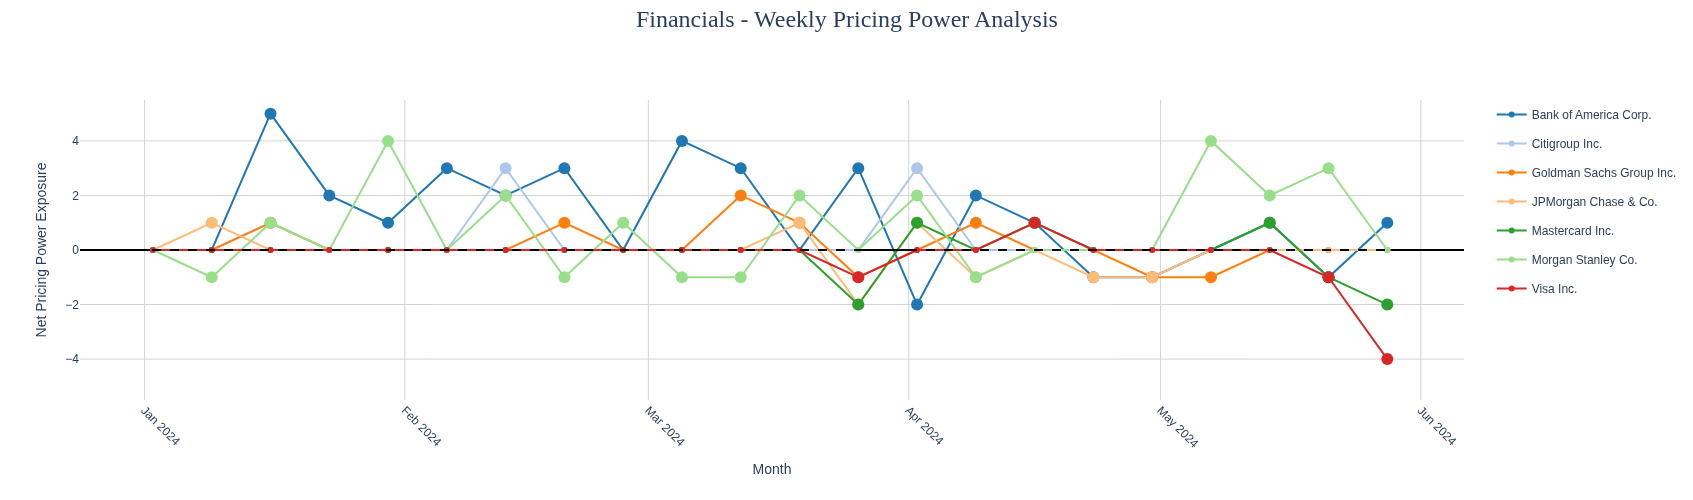
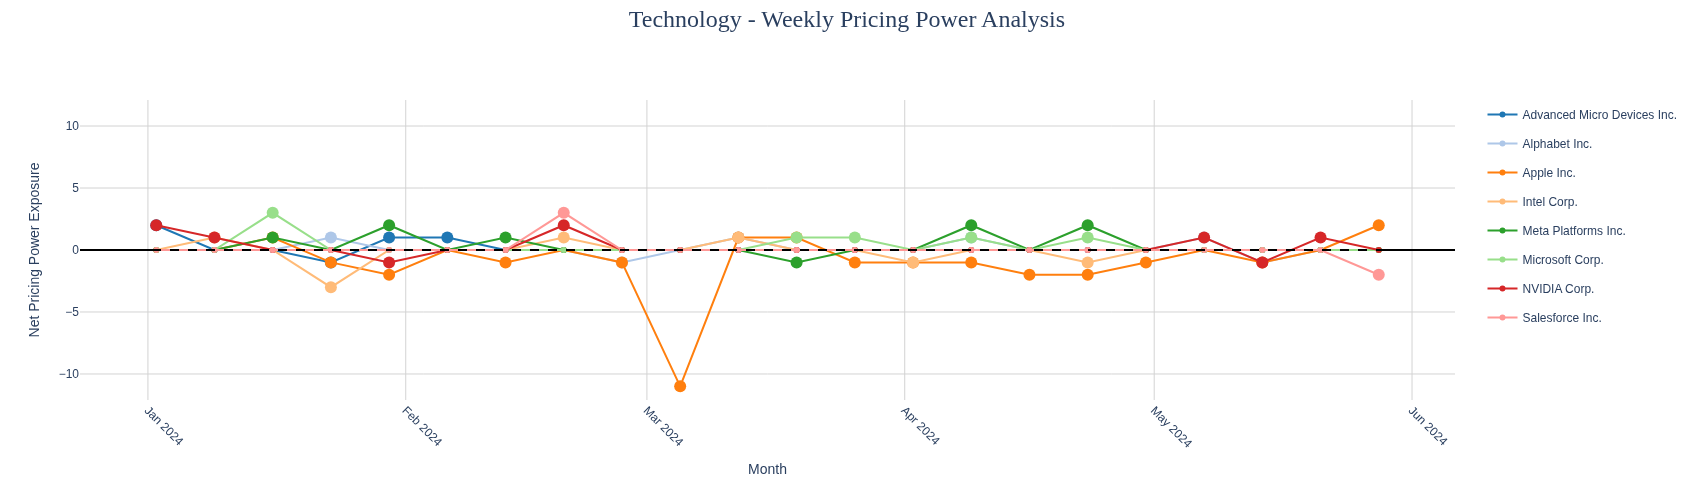
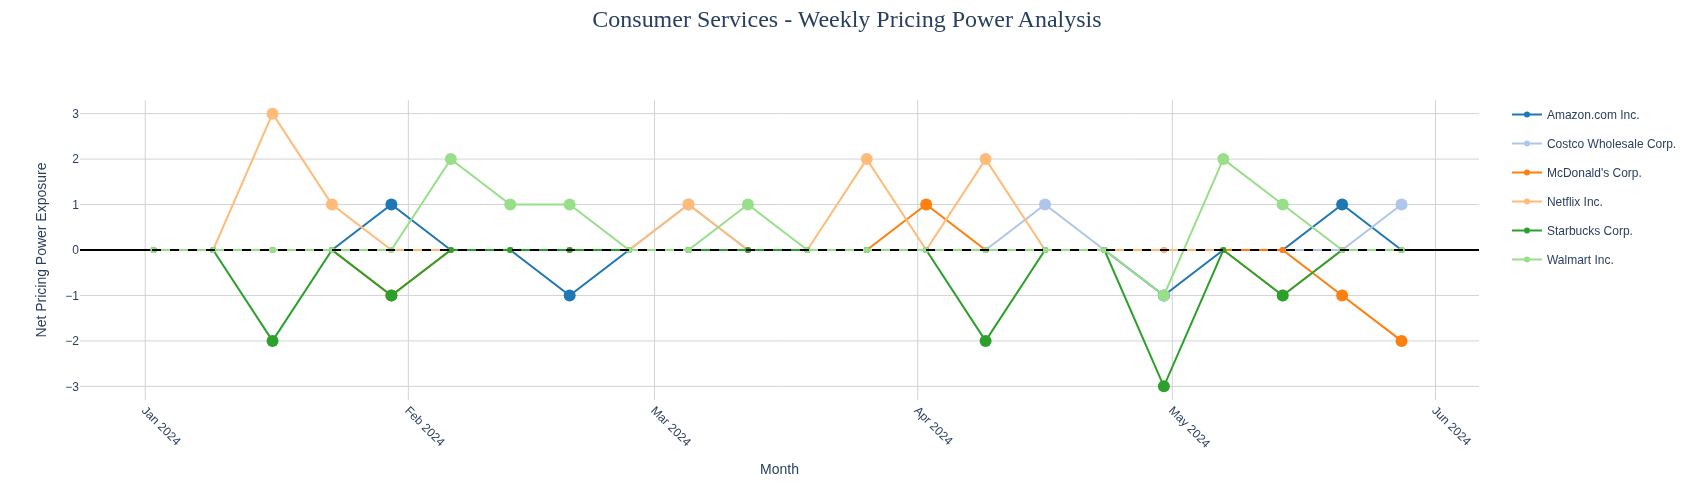
Temporal Pricing Power Analysis

This time-series analysis tracks how pricing power narratives evolve over time for companies in our basket. The weekly analysis reveals:

  • Narrative Trends: How pricing power stories develop and change over time
  • Net Positioning: The balance between positive and negative pricing power mentions over time

Each line represents a company’s “net pricing power exposure” (positive mentions minus negative mentions). Points above zero indicate weeks with net positive pricing power signals, while points below zero show weeks with net negative signals.

weekly_exposure = analyze_basket_weekly_with_labels(df_positive_relevant, df_negative_relevant, companies_basket, start_date, end_date, 'Sector')
Weekly Analysis - Financial
Weekly Analysis - Technology
Weekly Analysis - Consumer Services

Key Insights and Market Stories

The temporal analysis reveals several notable pricing power stories:

PepsiCo's Price Resistance

PepsiCo’s price hikes were met with significant resistance from major retailers like Carrefour, which stopped selling PepsiCo products in several European countries. The company experienced declining sales volume in Q1 2024, demonstrating the limits of pricing power when customers have alternatives.

Quick Service Restaurant Challenges

McDonald’s and Starbucks faced customer backlash and reduced customer counts due to their price increases, indicating that even strong brands face constraints when pricing exceeds customer willingness to pay, particularly among price-sensitive consumers.

Successful Pricing Power Examples

Spotify demonstrated strong pricing power within the streaming industry, successfully raising subscription prices while justifying increases through improved product offerings and maintaining customer loyalty.

These examples illustrate that pricing power is dynamic and context-dependent, influenced by factors such as brand strength, competitive alternatives, and economic conditions.

Export the Results

Export the data as Excel files for further analysis or to share with the team.

try:
    # Create the Excel manager
    excel_manager = ExcelManager()

    # Define the dataframes and their sheet configurations
    df_args = [
        (df_positive_relevant, "Positive Pricing Power", (0, 0)),
        (df_negative_relevant, "Negative Pricing Power", (0, 0)),
        (companies_basket, "Pricing Power Basket", (2, 4)),
        (weekly_exposure, "Weekly Exposure Analysis", (2, 2))
    ]

    # Save the workbook
    excel_manager.save_workbook(df_args, export_path)

except Exception as e:
    print(f"Warning while exporting to excel: {e}")

Conclusion

The Pricing Power Analysis provides a comprehensive automated framework for analyzing pricing dynamics and competitive positioning across your investment universe. By systematically combining advanced information retrieval with LLM-powered sentiment analysis, this workflow transforms unstructured news data into actionable intelligence for strategic decision-making.

Through the automated analysis of pricing power narratives, you can:

  1. Identify pricing leaders - Discover companies with sustainable competitive advantages that allow them to control pricing in their markets

  2. Assess competitive positioning - Compare how companies within sectors respond to pricing pressures and maintain market share when implementing price increases

  3. Monitor pricing narrative evolution - Track how pricing power stories develop over time, identifying shifts in competitive dynamics and market leadership

  4. Generate sector intelligence - Create comprehensive reports on pricing dynamics across industries, revealing which sectors face commoditization versus those with differentiation opportunities

  5. Quantify pricing confidence - The confidence-based scoring system provides clear metrics to identify companies with strong pricing control versus those facing pricing challenges

  6. Analyze temporal patterns - Weekly tracking reveals how external factors, competitive responses, and market conditions impact pricing power over time

From conducting competitive analysis to building investment strategies focused on companies with sustainable pricing advantages or identifying short opportunities in commoditized sectors, the Pricing Power Analysis automates the research process while maintaining the depth required for professional investment analysis. The standardized methodology ensures consistent evaluation across companies, sectors, and time periods, making it an invaluable tool for systematic pricing power assessment in dynamic markets.