Why It Matters

Understanding inflation dynamics requires systematic analysis of complex, interconnected factors across the economy. Manually tracking inflation drivers across thousands of news reports, economic data releases, and market commentaries is time-consuming and prone to human bias. As inflation remains a critical concern for policymakers, investors, and analysts, there’s an urgent need for scalable, systematic approaches to monitor inflation themes.

What It Does

This workflow is a Macroeconomic Drivers Tracker that breaks down US Inflation into its main components and drivers, then analyzes detailed news reports to extract insights in a structured analytical report. Built for analysts, portfolio managers, and economic researchers, it transforms scattered economic narratives into structured intelligence about inflation dynamics.

How It Works

The workflow combines LLM-powered theme taxonomies, semantic content retrieval, and structured reporting methodologies to deliver:
  • Automated theme breakdown into specific inflation components and drivers
  • Systematic document analysis using embeddings-based search and classification
  • Economic categorization that turns narrative signals into structured insights
  • Comprehensive reporting with analytical summaries for each inflation driver

A Real-World Use Case

This cookbook demonstrates a complete inflation tracking workflow for United States Inflation in 2025, analyzing news coverage from January to February 2025 to identify key inflationary pressures, categorize their economic nature, and generate a professional analytical report. Ready to get started? Let’s dive in!
Open in GitHub

Prerequisites

To run the Inflation Tracking workflow, you can choose between two options:
  • 💻 GitHub cookbook
    • Use this if you prefer working locally or in a custom environment.
    • Follow the setup and execution instructions in the README.md.
    • API keys are required:
      • Option 1: Follow the key setup process described in the README.md
      • Option 2: Refer to this guide: How to initialise environment variables
        • ❗ When using this method, you must manually add the OpenAI API key:
          # OpenAI credentials
          OPENAI_API_KEY = "<YOUR_OPENAI_API_KEY>"
          
  • 🐳 Docker Installation
    • Docker installation is available for containerized deployment.
    • Provides an alternative setup method with containerized deployment, simplifying the environment configuration for those preferring Docker-based solutions.

Setup and Imports

Below is the Python code required for setting up the environment and importing necessary libraries.
import os
from logging import Logger, getLogger
from typing import Dict, List, Optional
import pandas as pd
from pandas import DataFrame, merge
from IPython.display import HTML, display

from bigdata_client import Bigdata
from bigdata_client.models.entities import Company
from bigdata_client.models.search import DocumentType, SortBy

from bigdata_research_tools.labeler.screener_labeler import ScreenerLabeler
from bigdata_research_tools.themes import (
    generate_theme_tree,
    stringify_label_summaries,
)
from bigdata_research_tools.excel import ExcelManager

from src.search import search_by_any
from src.token_manager import TokenManager
from src.summarize import (
    topic_summary,
    summarize_topic_by_theme,
    create_intro_section,
    create_html_report,
    prepare_html_for_display
)
from src.labels import (
    process_request,
    deserialize_responses,
    get_prompts,
    get_topic_drivers_tag_prompt,
    create_label_to_parent_mapping,
    map_risk_category
)
from src.mind_map_tools import (
    get_most_granular_elements
)

# Define output file paths for results
output_dir = "output"
os.makedirs(output_dir, exist_ok=True)

Defining Inflation Analysis Parameters

  • Main Theme (main_theme): The central macroeconomic concept to explore
  • Time Period (start_date and end_date): The date range over which to run the search
  • Document Type (document_type): Specify which documents to search over (transcripts, filings, news)
  • Model Selection (llm_model): The LLM model used to mindmap the theme and label the search result chunks
  • Rerank Threshold (rerank_threshold): By setting this value, you’re enabling the cross-encoder which reranks the results and selects those whose relevance is above the percentile you specify (0.7 being the 70th percentile)
  • Focus (focus): Specify a focus within the main theme. This will then be used in building the LLM generated mindmapper
  • Source Country (source_country): Specify the country from which the document originates
  • Frequency (freq): The frequency of the date ranges to search over. Supported values:
    • Y: Yearly intervals
    • M: Monthly intervals
    • W: Weekly intervals
    • D: Daily intervals. Defaults to M
  • Document Limit (document_limit): The maximum number of documents to return per query to Bigdata API
  • Batch Size (batch_size): The number of entities to include in a single batched query
  • Sort By (sortby): Parameter to rank the search results
# ===== Theme Definition =====
main_theme = "United States Inflation in 2025"

# ===== Focus Definition =====
focus = f"Provide a detailed breakdown of {main_theme} in its main bottom-up components and drivers."

# ===== LLM Specification =====
llm_model = "openai::gpt-4o-mini"

# ===== Document Configuration =====
document_type = DocumentType.NEWS
sortby = SortBy.RELEVANCE

# ===== Enable/Disable Reranker =====
rerank_threshold = None

# ===== Specify Time Range =====
start_date = "2025-01-01"
end_date = "2025-02-28"

# ===== Search Parameters =====
source_country = {'place':['United States']}
freq = "M"
document_limit = 200
batch_size = 100

Mindmap a Theme Taxonomy with Bigdata Research Tools

You can leverage Bigdata Research Tools to generate a comprehensive theme taxonomy with an LLM, breaking down a theme into smaller, well-defined concepts or sub-themes for more targeted analysis. In this case we are able to extract the drivers
theme_tree = generate_theme_tree(
    main_theme=main_theme,
    focus=focus,
)

sentences_query = theme_tree.get_summaries()
label_to_parent_mapping = theme_tree.get_label_to_parent_mapping()
unique_themes = list(set(label_to_parent_mapping.values()))

theme_tree.visualize()
Inflation Theme Tree showing breakdown into main components and drivers

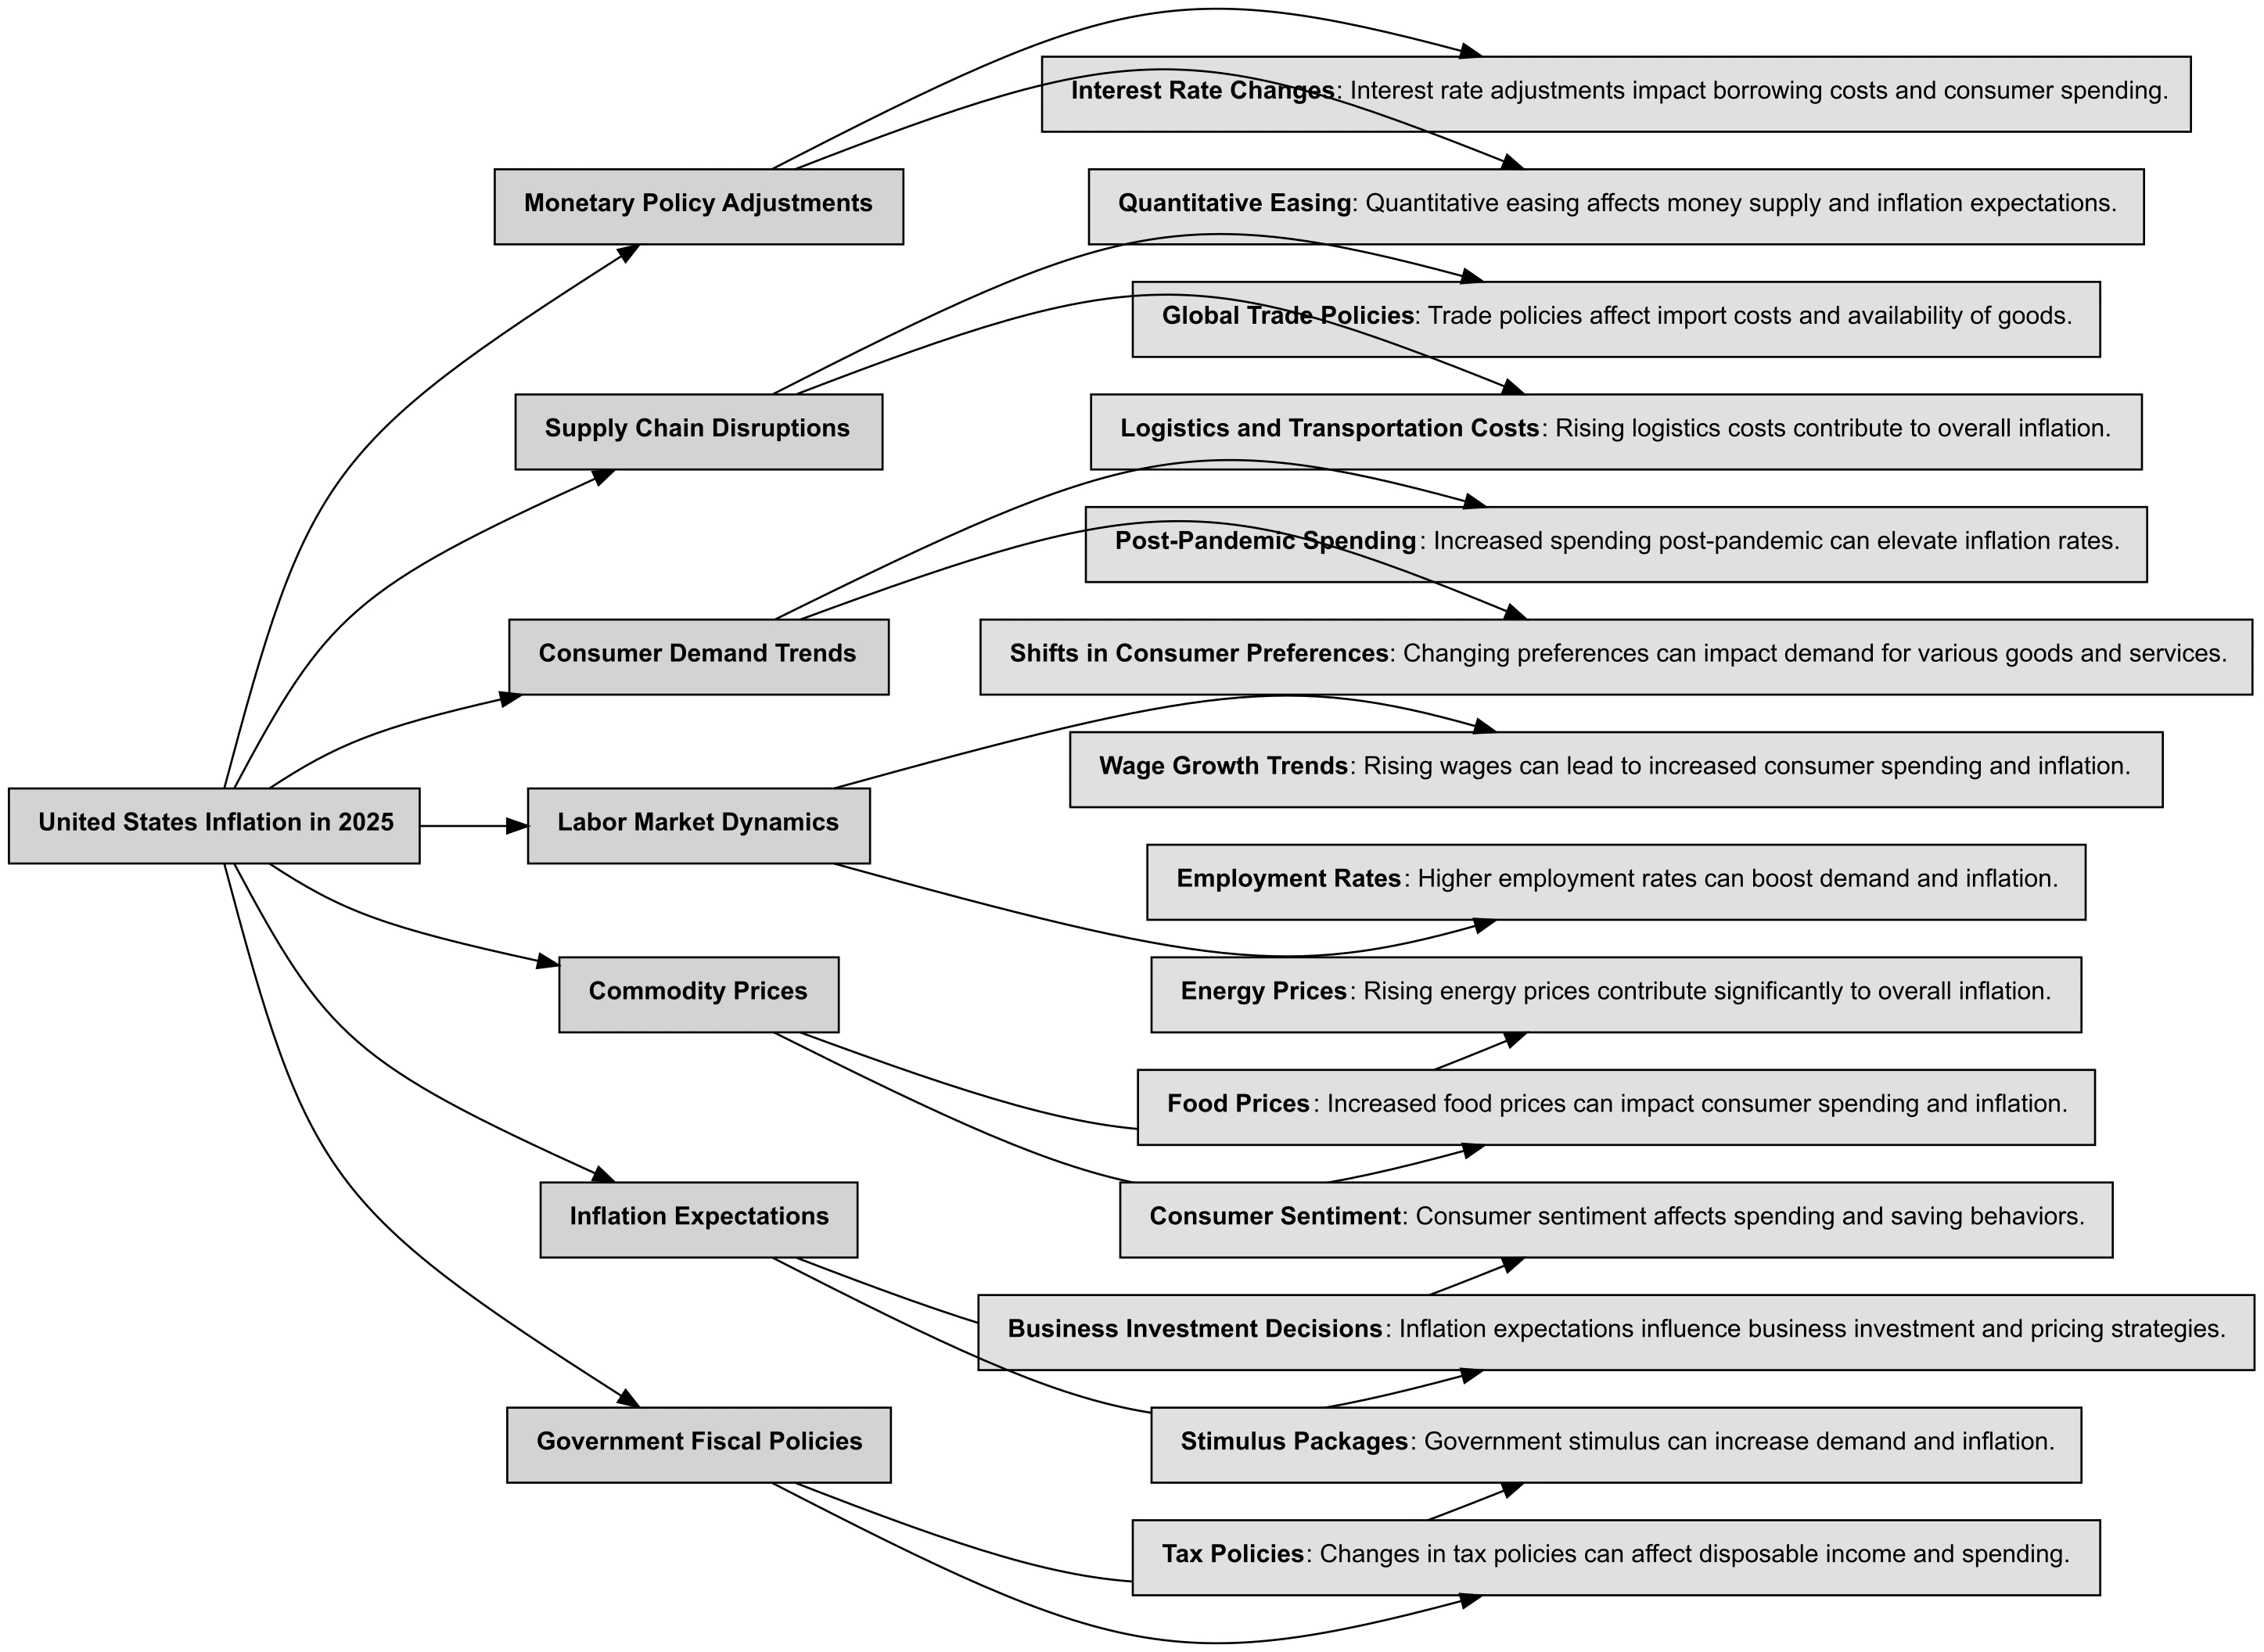
Retrieve Content using Bigdata’s Search Capabilities

With the theme taxonomy and screening parameters, you can leverage the Bigdata API to run a search across all the news.
# Use search_by_any for broad company discovery
df_sentences = search_by_any(
    sentences=sentences_query,
    start_date=start_date,
    end_date=end_date,
    scope=document_type,
    companies=None,  # Open discovery - all companies
    control_entities= source_country,
    freq=freq,
    sort_by=sortby,
    rerank_threshold=rerank_threshold,
    document_limit=document_limit,
    batch_size=batch_size,
    bigdata=bigdata
)

Label the Results

Use an LLM to analyze each text chunk and determine its relevance to the inflation sub-themes. Any chunks which aren’t explicitly linked to US inflation components will be filtered out.
labeler = ScreenerLabeler(llm_model=llm_model)
df_labels = labeler.get_labels(
    main_theme=main_theme,
    labels=list(theme_tree.get_terminal_label_summaries().keys()),
    texts=df_sentences["masked_text"].tolist(),
)

# Merge and process results
df = merge(df_sentences, df_labels, left_index=True, right_index=True)
df = labeler.post_process_dataframe(df)

# Filter out 'Not Applicable' results
df_labeled_extracted = df.loc[~(df.Theme.eq('Not Applicable'))].copy()

# Map the labels to the themes
df_labeled_extracted = df_labeled_extracted.rename(columns={'Theme': 'label'})
df_labeled_extracted['theme'] = df_labeled_extracted['label'].map(label_to_parent_mapping)

Text Summarization

This process concatenates all the text for a given label and instructs an LLM to summarize the text retrieved for each driver. The LLM is specifically instructed to generate an analytical summary that is rich in insights and figures, and excludes events and numbers that are outside of the timeframe of the report.
df_summaries = summarize_topic_by_theme(
    df_labeled_extracted, 
    df_labeled_extracted.theme.unique(),
    df_labeled_extracted.label.unique(), 
    themes_tree_dict= "", 
    api=OPENAI_API_KEY, 
    start_date=start_date, 
    end_date=end_date   
)
In addition, the LLM is instructed to categorize the drivers according to their nature, using specific drivers_tags
drivers_tags = [
    'Demand-pull: When consumer demand exceeds the available supply of goods and services, driving prices up.', 
    'Cost-push: When production costs like labor or raw materials increase, forcing businesses to raise prices.', 
    'Wage increases: Rising wages can contribute to inflation if businesses pass on those costs to consumers in the form of higher prices.', 
    'Global factors: International commodity price fluctuations and exchange rate changes can impact inflation within a country.', 
    'Monetary policy: Central banks actions, like adjusting interest rates, can influence inflation level'
]

tags_prompt = get_topic_drivers_tag_prompt(main_theme, "\n- ".join(drivers_tags))

df_summaries['id'] = range(len(df_summaries))
prompts = get_prompts(df_summaries, columns=['id', 'theme','topic', 'topic_summary'])

responses_tag = process_request(prompts, tags_prompt, api_key=OPENAI_API_KEY)

df_tag = deserialize_responses(responses_tag)

# Concat the original DataFrame with the labels
df_summaries_tag = pd.merge(df_summaries.reset_index(), df_tag.reset_index(),
                      on='index', how='left').drop('index',axis=1)

Generate the Report

As a final step, an LLM uses the last dataframe to generate a brief introduction for the report, summarizing the contents in a few sentences. The report is then formatted and composed by organizing it by the key driver labels defined above and rendering it in HTML format.
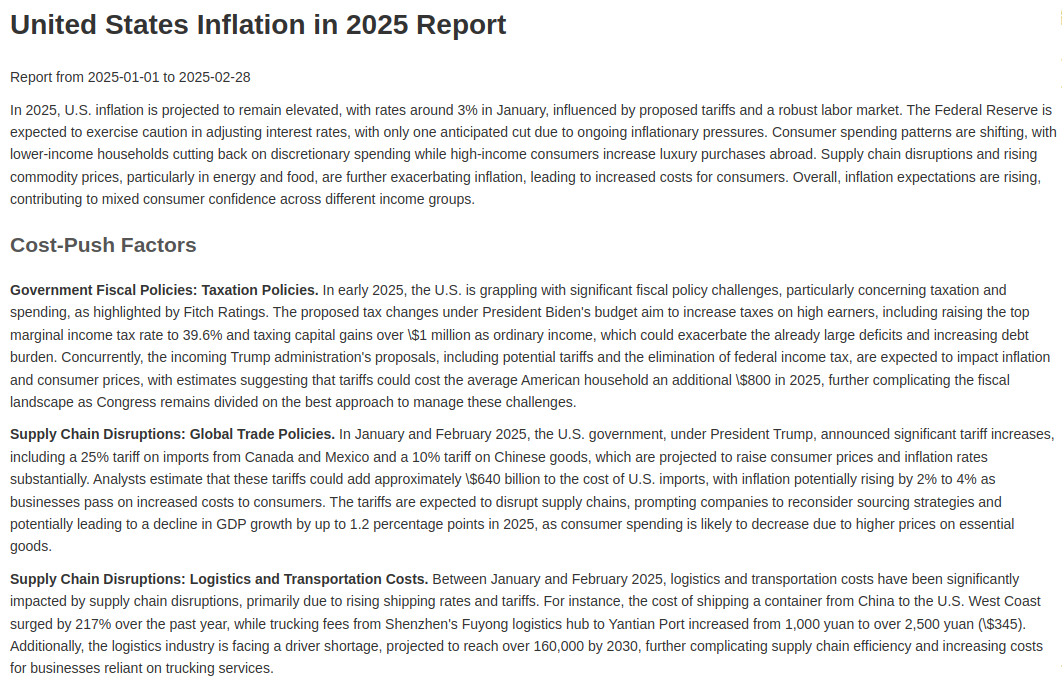
# Create HTML report
intro_section = create_intro_section(df_summaries_tag, OPENAI_API_KEY, main_theme)
html_report = create_html_report(main_theme, start_date, end_date, intro_section, df_summaries_tag)
display(HTML(prepare_html_for_display(html_report)))

Sample HTML report showing inflation drivers categorized by economic type
# Save HTML report to file
html_report_path = f'{output_dir}/United_States_Inflation_Report_2025.html'
with open(html_report_path, 'w') as file:
    file.write(html_report)
print(f"✅ HTML report saved to {html_report_path}")

Export the Results

Export the data as Excel files for further analysis or to share with the team.
# Export data to Excel
try:
    # Create the Excel manager
    excel_manager = ExcelManager()

    # Define the dataframes and their sheet configurations
    df_args = [
        (df_labeled_extracted, "Labeled Inflation Data", (0, 0)),
        (df_summaries, "Topic Summaries", (2, 4)),
        (df_summaries_tag, "Final Tagged Report", (2, 2))
    ]

    # Save the workbook
    excel_report_path = f'{output_dir}/inflation_analysis_results.xlsx'
    excel_manager.save_workbook(df_args, excel_report_path)
    print(f"✅ Excel results exported to {excel_report_path}")

except Exception as e:
    print(f"Warning while exporting to excel: {e}")

Conclusion

The Inflation Tracking workflow provides a comprehensive automated framework for monitoring and analyzing US inflation dynamics across multiple economic dimensions. By systematically combining advanced information retrieval with LLM-powered categorization, this workflow transforms unstructured news data into structured intelligence for economic analysis and decision-making. Through automated analysis of inflation drivers and their economic categorization, analysts can:
  1. Identify Key Inflation Pressures - Systematically discover and quantify the primary drivers of inflation across different economic sectors and categories
  2. Categorize Driver Types - Automatically classify inflation pressures according to established economic frameworks (demand-pull, cost-push, monetary policy, etc.)
  3. Generate Professional Reports - Create comprehensive, evidence-based reports that can inform policy discussions, investment decisions, and economic research
  4. Scale Economic Analysis - Process thousands of news reports and economic commentaries that would be impossible to analyze manually
From conducting macroeconomic research to supporting central bank analysis or building inflation-focused investment strategies, the Inflation Tracking workflow automates the research process while maintaining the analytical depth required for professional economic analysis. The standardized categorization methodology ensures consistent evaluation across time periods and different inflation episodes, making it an invaluable tool for systematic inflation monitoring and analysis.