

CHART message.
This works on both the Research Agent (/v1/research-agent) and Workflows
(/v1/workflow/execute).
Security
Each request runs in its own sandbox on a fresh process. No state is kept between requests. The code the model writes never sees your credentials. It cannot reach arbitrary external services. It can only read Bigdata’s own governed data APIs.Usage
Code execution can run several analysis steps in one request. It can therefore use more content than a plain query. We monitor and optimize this with internal evaluations to keep it efficient. You can turn the tool off per request if you prefer.Configuration
Configure code execution under thepython_code_execution key of tools_configs:
enabledsets whether the agent may run Python. Set it tofalseto turn code execution off for a request.chart_generation_enabledsets whether the agent may produce charts. Charts are off by default. Leave thisfalseif you only want computed results in the answer text and noCHARTmessages.
python_code_execution config on a template’s
tools_configs. Every run of that template then uses it.
Charts
Whenchart_generation_enabled is true and the agent decides a chart helps, it
sends a CHART message.
Each CHART message includes a vega_lite_spec. This is a standard
Vega-Lite specification. You can render it
with any Vega-Lite renderer. Each message also includes start and end offsets.
These point to a span of the answer text, so you can place the chart where the answer
refers to it. This is the same offset model used by
grounding citations.
Example
Take a request such as “Chart Tesla’s total quarterly revenue for the last six reported quarters.” The agent pulls the figures from Bigdata’s financials data, computes the series, and returns aCHART message. Rendering its vega_lite_spec
produces this chart:
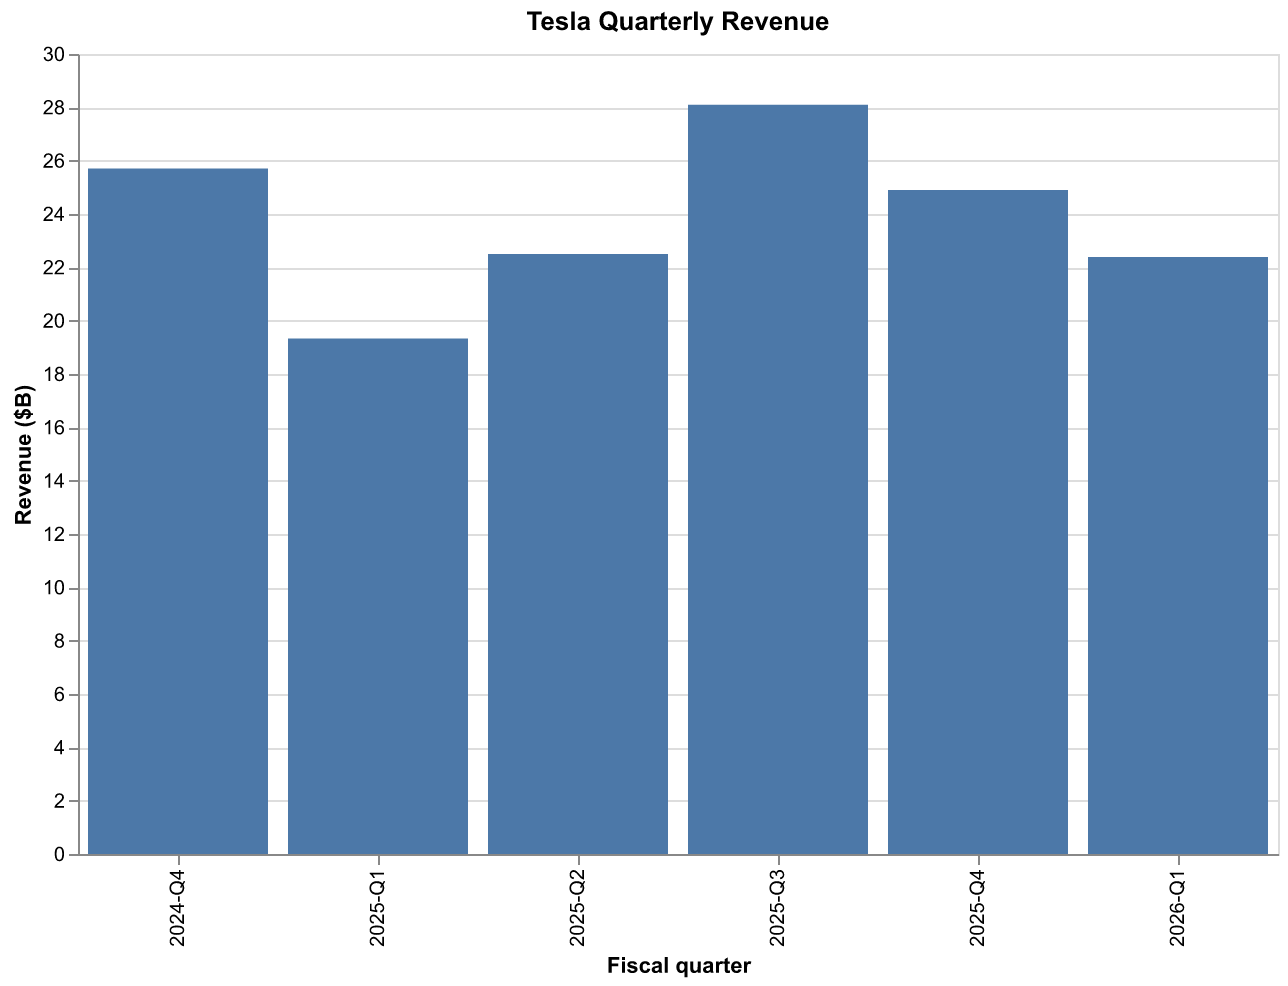
vega_lite_spec in the CHART message.