Overview
The Earnings Call Preview prompt helps senior equity analysts prepare comprehensive analysis briefs before upcoming earnings calls. This prompt generates actionable intelligence covering recent developments, industry dynamics, bull/bear cases, and key metrics to watch. By leveraging Bigdata.com MCP tools, the prompt enables analysts to quickly gather competitive analysis and recent news to build a complete picture of what to expect. The resulting brief provides the structured analysis needed to ask informed questions and anticipate potential market-moving announcements.Prompt
You are a senior equity analyst preparing for an upcoming earnings call. Please provide a comprehensive earnings preview and analysis for Micron.

Cover:
- Recent developments and initiatives
- Industry trends and sector dynamics
- Bull/bear cases
- Key metrics to watch

Deliverable Format: Present findings as a concise, actionable brief suitable for investment professionals. Focus on business fundamentals, avoid speculation, and highlight areas of uncertainty or debate. Be decisive in your assessments while acknowledging alternative viewpoints. Add inline source attribution and use the Bigdata MCP.
Example Output
- Claude
You can copy and paste the prompt above in Claude.ai or Claude Desktop.The output will be similar to the following example: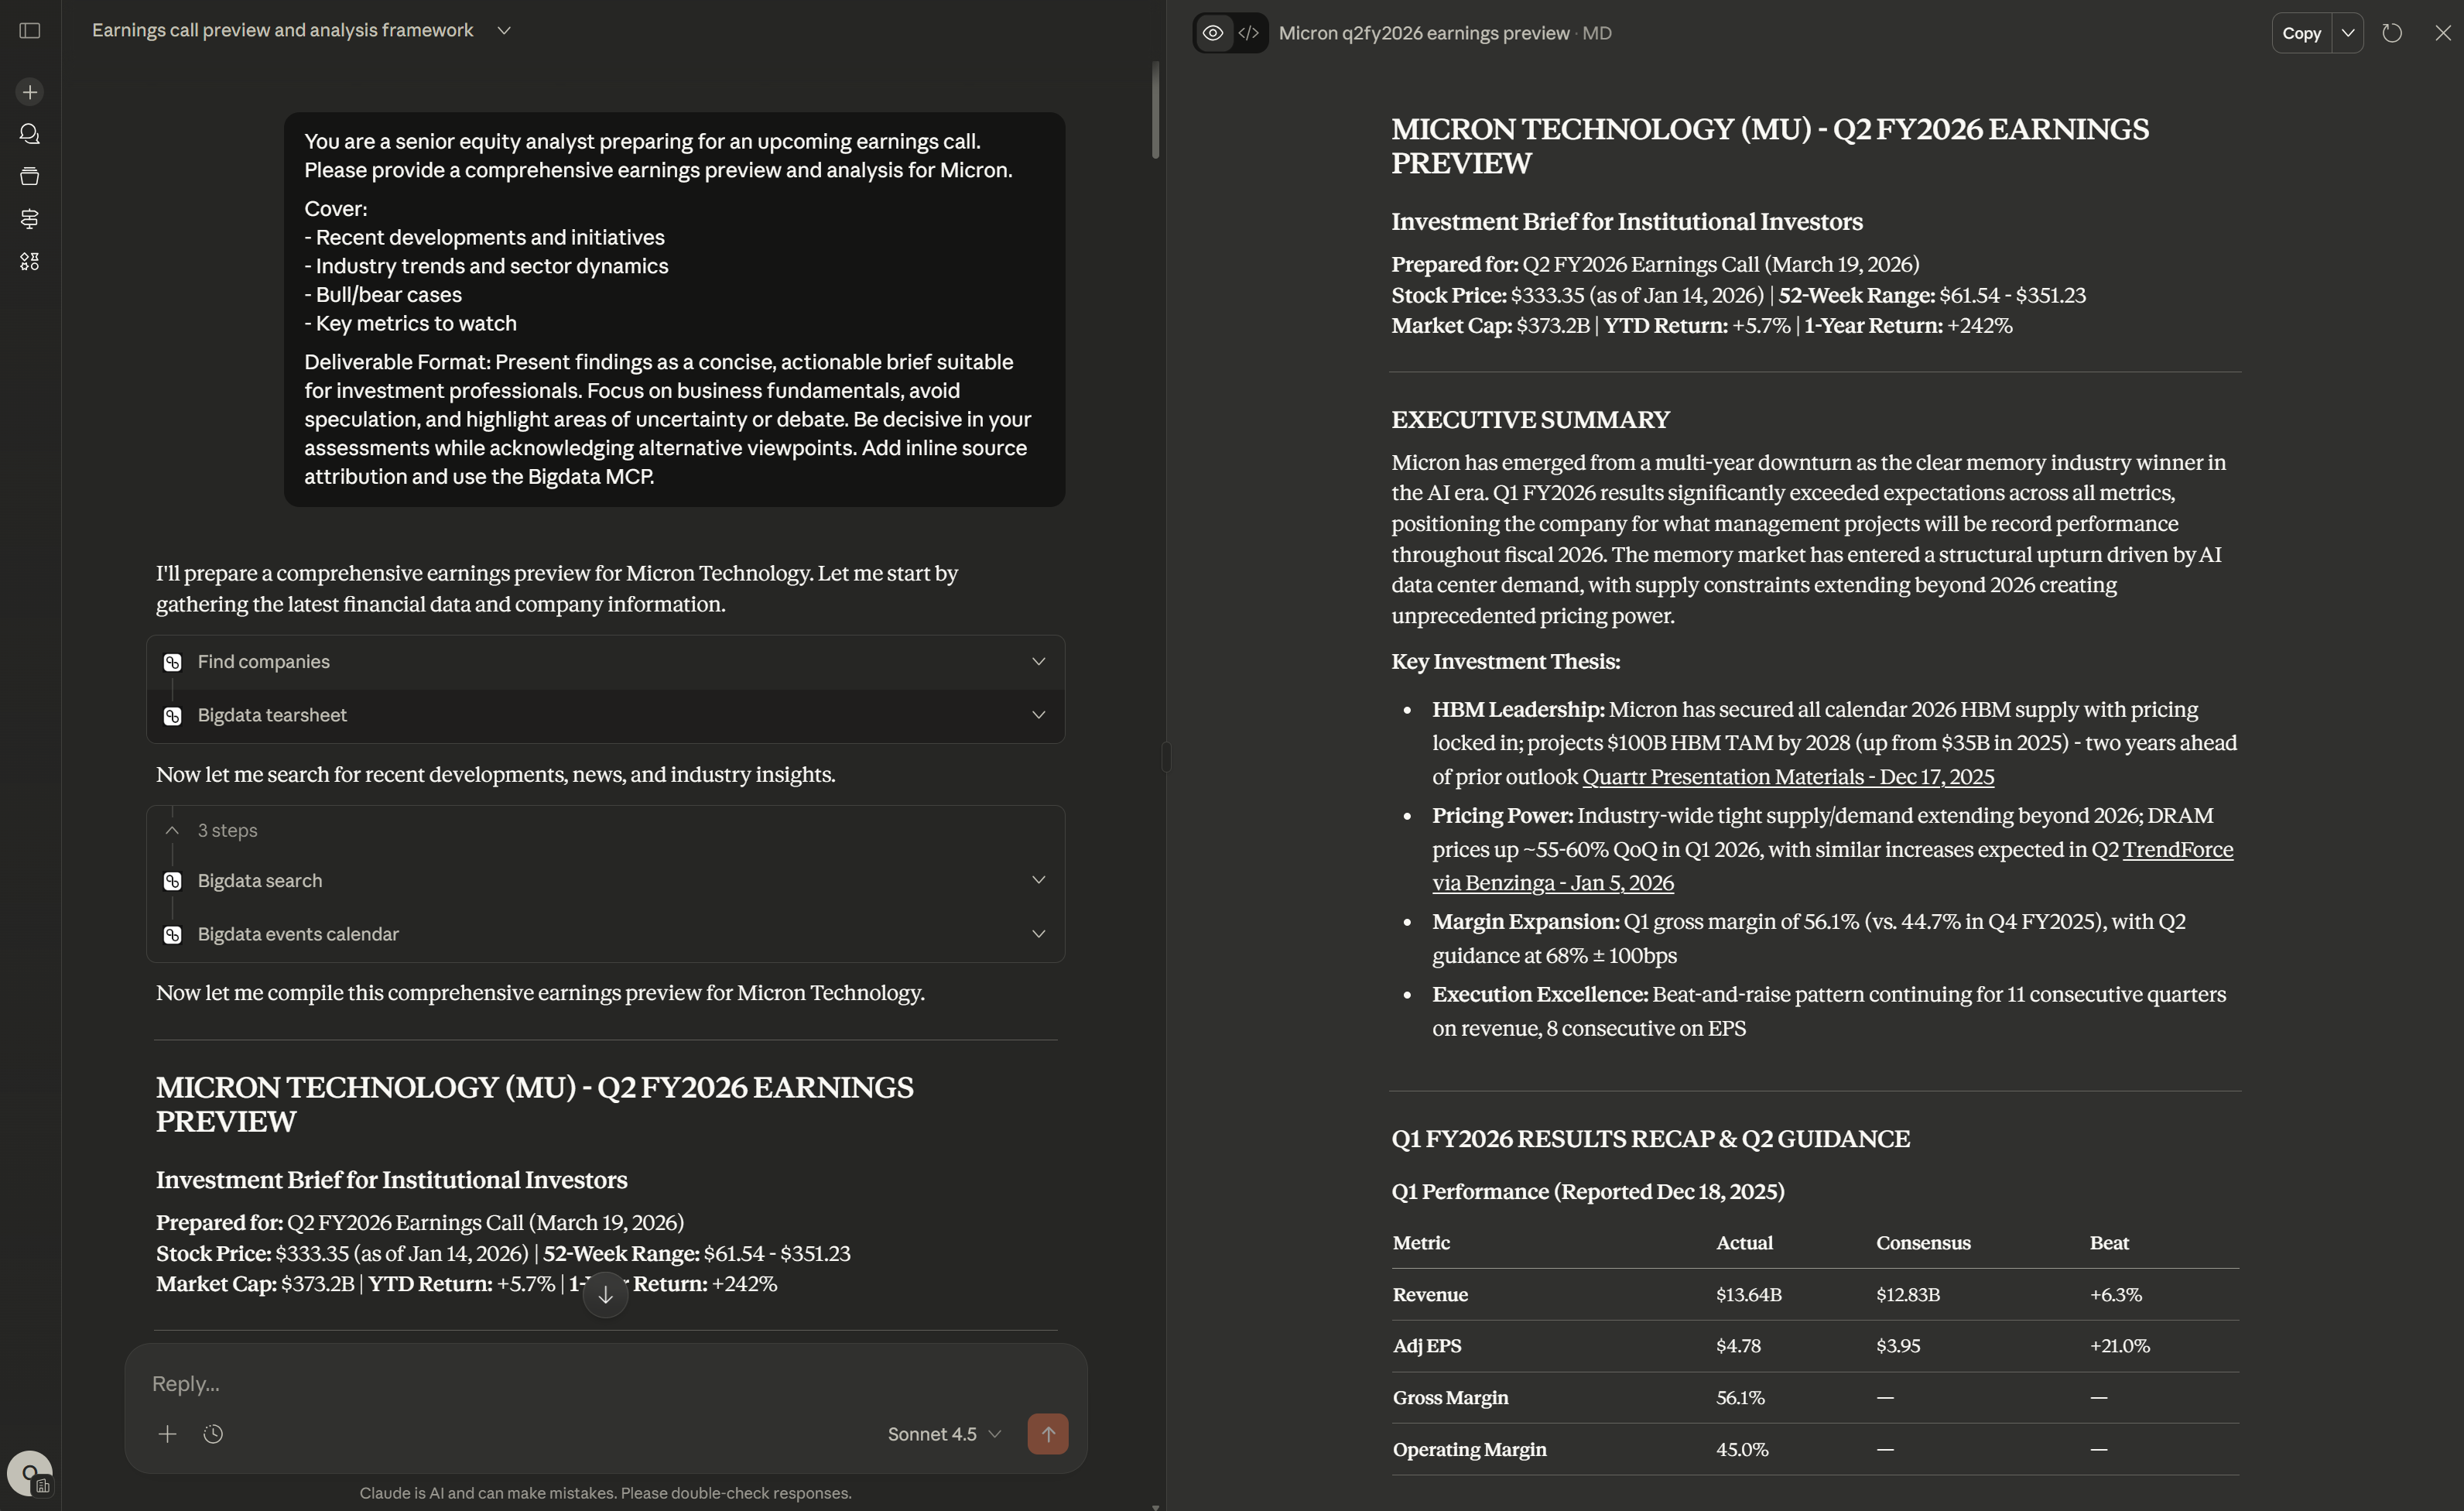
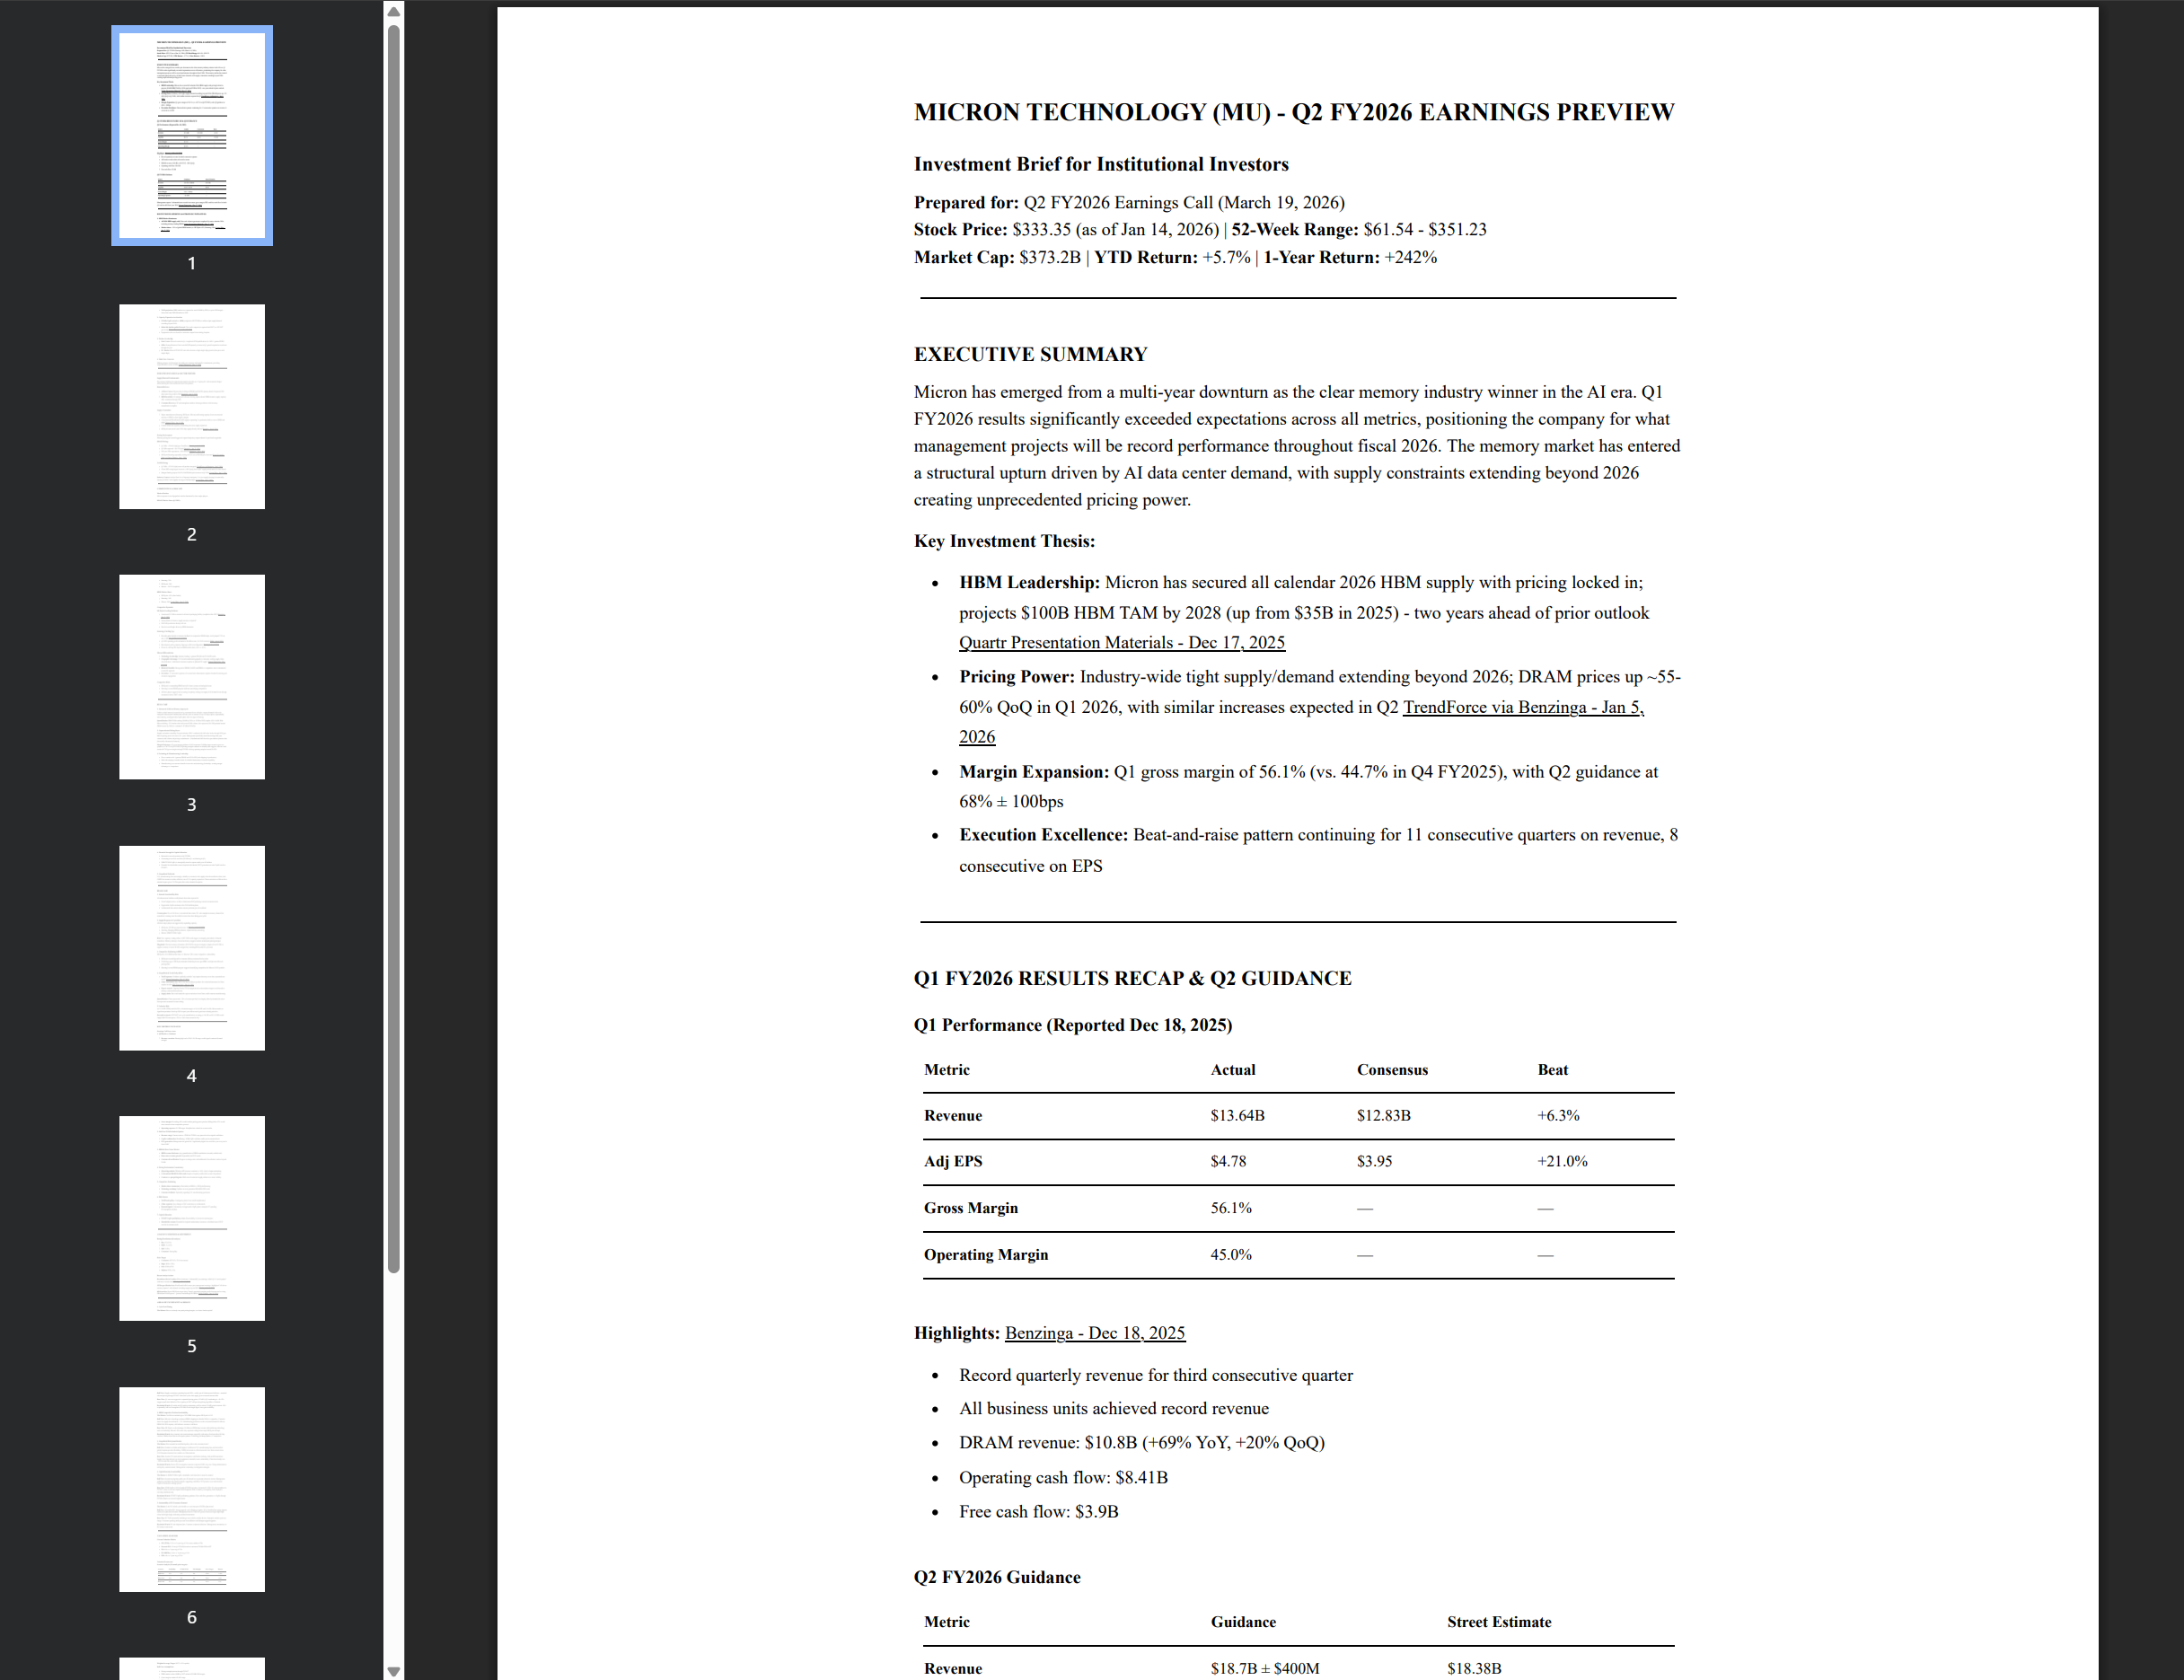
# **MICRON TECHNOLOGY (MU) - Q2 FY2026 EARNINGS PREVIEW**
## **Investment Brief for Institutional Investors**

**Prepared for:** Q2 FY2026 Earnings Call (March 19, 2026)
**Stock Price:** $333.35 (as of Jan 14, 2026) | **52-Week Range:** $61.54 - $351.23
**Market Cap:** $373.2B | **YTD Return:** +5.7% | **1-Year Return:** +242%

---

## **EXECUTIVE SUMMARY**

Micron has emerged from a multi-year downturn as the clear memory industry winner in the AI era. Q1 FY2026 results significantly exceeded expectations across all metrics, positioning the company for what management projects will be record performance throughout fiscal 2026. The memory market has entered a structural upturn driven by AI data center demand, with supply constraints extending beyond 2026 creating unprecedented pricing power.

**Key Investment Thesis:**
- **HBM Leadership:** Micron has secured all calendar 2026 HBM supply with pricing locked in; projects $100B HBM TAM by 2028 (up from $35B in 2025) - two years ahead of prior outlook [Quartr Presentation Materials - Dec 17, 2025](https://files.quartr.com/conference-calls/973ef-2025-12-18-01-50-16.pdf?ref=UmF2ZW5QYWNr)
- **Pricing Power:** Industry-wide tight supply/demand extending beyond 2026; DRAM prices up ~55-60% QoQ in Q1 2026, with similar increases expected in Q2 [TrendForce via Benzinga - Jan 5, 2026](https://www.benzinga.com/node/49688626)
- **Margin Expansion:** Q1 gross margin of 56.1% (vs. 44.7% in Q4 FY2025), with Q2 guidance at 68% ± 100bps
- **Execution Excellence:** Beat-and-raise pattern continuing for 11 consecutive quarters on revenue, 8 consecutive on EPS

---

## **Q1 FY2026 RESULTS RECAP & Q2 GUIDANCE**

### **Q1 Performance (Reported Dec 18, 2025)**
| Metric | Actual | Consensus | Beat |
|--------|--------|-----------|------|
| **Revenue** | $13.64B | $12.83B | +6.3% |
| **Adj EPS** | $4.78 | $3.95 | +21.0% |
| **Gross Margin** | 56.1% | — | — |
| **Operating Margin** | 45.0% | — | — |

**Highlights:** [Benzinga - Dec 18, 2025](https://www.benzinga.com/node/49479068)
- Record quarterly revenue for third consecutive quarter
- All business units achieved record revenue
- DRAM revenue: $10.8B (+69% YoY, +20% QoQ)
- Operating cash flow: $8.41B
- Free cash flow: $3.9B

### **Q2 FY2026 Guidance**
| Metric | Guidance | Street Estimate |
|--------|----------|-----------------|
| **Revenue** | $18.7B ± $400M | $18.38B |
| **Adj EPS** | $8.42 ± $0.20 | $8.24 |
| **Gross Margin** | 68% ± 100bps | — |
| **Operating Expenses** | ~$1.38B | — |

Management expects "substantial new records in revenue, gross margin, EPS, and free cash flow for both Q2 and the full fiscal year 2026" [Factset Transcripts - Dec 17, 2025](https://app.bigdata.com/files#?document=380D565223B1B02F9D38FA98159DD34C)

---

## **RECENT DEVELOPMENTS & STRATEGIC INITIATIVES**

### **1. HBM Market Dominance**
- **All 2026 HBM supply sold:** Price and volume agreements completed for entire calendar 2026, including industry-leading HBM4 [Quartr Presentation Materials - Dec 17, 2025](https://files.quartr.com/conference-calls/973ef-2025-12-18-01-50-16.pdf?ref=UmF2ZW5QYWNr)
- **Market share:** ~21% of global HBM market (vs. SK Hynix 61%, Samsung 19%) [Crypto Wire - Jan 13, 2026](https://blockonomi.com/sk-hynix-stock-why-this-chipmaker-is-betting-13b-on-ai-memory/)
- **TAM projection:** HBM market now expected to reach $100B by 2028 (vs. prior 2030 target) - faster than entire DRAM market in 2024

### **2. Capacity Expansion Acceleration**
- **FY2026 CapEx raised to ~$20B** (weighted to H2 FY2026) to address tight supply/demand extending beyond 2026
- **Idaho fab timeline pulled forward:** First wafer output now expected mid-2027 (vs. H2 2027 previously) [Factset Transcripts - Dec 17, 2025](https://app.bigdata.com/files#?document=380D565223B1B02F9D38FA98159DD34C)
- Equipment orders accelerated to maximize output from existing footprint

### **3. Product Leadership**
- **Data Center:** Record revenue in Q1; completed OEM qualifications for 16Gb 1-gamma DDR5
- **SSDs:** Storage Business Unit exceeded $1B quarterly revenue in Q1; growth expected to accelerate through the year
- **PC Market:** Raised CY2025 PC unit sales forecast to high-single-digit growth (from prior mid-single-digit)

### **4. Multi-Year Contracts**
Making progress on discussions for multi-year contracts with specific commitments, providing unprecedented revenue visibility [Quartr Transcripts - Dec 17, 2025](https://app.bigdata.com/files#?document=F4AE77F0227D51A3B55C6AADF256CBC5)

---

## **INDUSTRY DYNAMICS & SECTOR TRENDS**

### **Supply/Demand Fundamentals**
The memory industry has entered what analysts describe as a "supercycle" with structural changes differentiating this from traditional boom-bust patterns:

**Demand Drivers:**
1. **AI Data Centers:** Hyperscalers locking in DRAM and NAND capacity ahead of expected 50% data center bit growth in 2026 [Benzinga - Jan 13, 2026](https://www.benzinga.com/node/49887383)
2. **HBM Insatiable:** AI training and inference driving unprecedented HBM demand; supply capacity fully committed through 2026
3. **Consumer Recovery:** PC and smartphone markets showing resilience with inventory normalization complete

**Supply Constraints:**
- Major manufacturers (Samsung, SK Hynix, Micron) reallocating capacity from conventional memory to HBM to chase higher margins
- "Conventional DRAM and NAND supply evaporating" as production shifts to server DDR5 and HBM [Tahawul Tech - Jan 8, 2026](https://www.tahawultech.com/?p=111817)
- Limited cleanroom capacity constraining near-term supply expansion
- SK Hynix announced entire 2026 chip supply already sold out [Benzinga - Jan 8, 2026](https://www.benzinga.com/node/49776348)

### **Pricing Environment**
Memory pricing has entered aggressive upward trajectory unprecedented in speed and magnitude:

**DRAM Pricing:**
- Q1 2026: +55-60% QoQ (per TrendForce) [Benzinga - Jan 5, 2026](https://www.benzinga.com/node/49688626)
- Q2 2026 expected: +10-12% QoQ [Benzinga - Jan 13, 2026](https://www.benzinga.com/node/49887383)
- Full year 2026 expectation: ~60% increase [Benzinga - Jan 9, 2026](https://www.benzinga.com/node/49818404)
- SK Hynix/Samsung reportedly seeking 60-70% server DRAM price increases [Korea Economic Daily via Yahoo Finance - Jan 6, 2026](https://finance.yahoo.com/news/sandisk-1-000-rally-turbocharged-174611894.html)

**NAND Pricing:**
- Q1 2026: +33-38% QoQ across all product categories [TrendForce via Benzinga - Jan 5, 2026](https://www.benzinga.com/node/49688626)
- Client SSD seeing largest increases (+40% QoQ) due to QLC supply prioritization for data centers
- Morgan Stanley projects 30-35% NAND flash price increase in Q1 2026 [Crypto Wire - Jan 7, 2026](https://blockonomi.com/sandisk-sndk-stock-hits-all-time-high-after-nvidia-ceos-ces-comments/)

**Industry Context:**
Analyst Peter Lee (Citigroup) anticipates "a severe supply shortage in commodity memory in 2026," with supplier leverage at all-time highs [Crypto Wire - Jan 7, 2026](https://blockonomi.com/samsung-stock-memory-chip-giant-plans-1-7-billion-buyback-as-earnings-surge/)

---

## **COMPETITIVE LANDSCAPE**

### **Market Position**
Micron operates in an oligopolistic market dominated by three major players:

**DRAM Market Share (Q3 2025):**
- Samsung: 33%
- SK Hynix: 34%
- Micron: ~30-33% (implied)

**HBM Market Share:**
- SK Hynix: 61% (clear leader)
- Samsung: 19%
- Micron: 20% [Crypto Wire - Jan 13, 2026](https://blockonomi.com/sk-hynix-stock-why-this-chipmaker-is-betting-13b-on-ai-memory/)

### **Competitive Dynamics**

**SK Hynix (Leading Position):**
- Announced $12.9B investment in advanced packaging facility (completion late 2027) [Benzinga - Jan 13, 2026](https://www.benzinga.com/node/49868327)
- Secured letter of intent to supply memory to OpenAI
- Full 2026 production already sold out
- Stock at record highs driven by HBM dominance

**Samsung (Catching Up):**
- Recently gained positive customer feedback on competitive HBM4 chips, stock jumped 7.2% on Jan 2, 2026 [Crypto Wire - Jan 2, 2026](https://www.cryptopolitan.com/samsung-makes-headway-on-hbm4-chip/)
- Q4 2025 operating profit estimated at 20 trillion won (~3x YoY increase) [CNBC - Jan 8, 2026](https://www.cnbc.com/2026/01/08/samsung-electronics-estimates-surge-skyrocket-profit-ai-memory-prices-q4.html)
- Raised prices on key memory chips up to 60% since September [Benzinga - Jan 8, 2026](https://www.benzinga.com/node/49776348)
- However, still lags SK Hynix in HBM market share (19% vs. 61%)

**Micron Differentiation:**
1. **Technology Leadership:** Industry-leading 1-gamma DRAM and G9 NAND nodes
2. **Geographic Advantage:** U.S.-based manufacturing appeals to customers seeking supply chain diversification; "enthusiastic customer response to planned US supply" [Factset Transcripts - Dec 17, 2025](https://app.bigdata.com/files#?document=380D565223B1B02F9D38FA98159DD34C)
3. **Balanced Portfolio:** Strong across DRAM, NAND, and HBM vs. competitors more concentrated in specific segments
4. **Execution:** 11 consecutive quarters of revenue beats demonstrates superior demand forecasting and customer engagement

### **Competitive Risks**
- SK Hynix's commanding HBM lead (61% share) creates technological moat
- Samsung's recent HBM4 progress indicates intensifying competition
- All three players aggressively investing in capacity, risking oversupply if AI demand slows (though consensus is this is 2027+ risk)

---

## **BULL CASE**

### **1. Structural AI-Driven Memory Supercycle**
Unlike cyclical memory booms driven by consumer device refreshes, current demand is driven by enterprise infrastructure buildout that will take years to saturate. Every AI chip requires exponentially more memory, and hyperscaler CapEx plans show no signs of slowing.

**Quantification:** HBM TAM reaching $100B by 2028 (vs. $35B in 2025) implies 42% CAGR. With Micron holding ~21% market share and secured 2026 volume, this represents $14-21B potential annual HBM revenue by 2028 (vs. estimated ~$7-8B in FY2026).

### **2. Unprecedented Pricing Power**
Supply constraints extending "beyond calendar 2026" combined with full order books through 2026 give Micron pricing power not seen in 15+ years. Management specifically noted discussing multi-year contracts with volume and pricing commitments - a fundamental shift from the spot-market dynamics that historically characterized memory.

**Margin Trajectory:** Q2 gross margin guidance of 68% represents 2,400bps improvement in just two quarters (vs. 44.7% in Q4 FY2025). If pricing strength continues as industry data suggests, Micron could sustain 60-70% gross margins through FY2026, driving operating margins toward 50-55%.

### **3. Technology & Manufacturing Leadership**
- First to market with 1-gamma DRAM and G9 NAND (both shipping in production)
- Idaho fab ramping 6 months ahead of schedule demonstrates execution capability
- Manufacturing cost structure benefits from scale and technology leadership, creating margin advantage vs. competitors

### **4. Financial Strength & Capital Allocation**
- Returned to net cash position in Q1 FY2026
- Generating record free cash flow ($3.9B in Q1, accelerating in Q2)
- $20B FY2026 CapEx is strategically timed to capture multi-year AI buildout
- Potential for shareholder returns (buybacks/dividends) if FCF generation exceeds CapEx needs in FY2027+

### **5. Geopolitical Tailwinds**
U.S. manufacturing base increasingly valuable as customers seek supply chain diversification from Asia. CHIPS Act incentives reduce effective cost of U.S. capacity expansion. China restrictions on Micron have minimal impact given U.S./European data center demand absorption.

---

## **BEAR CASE**

### **1. Demand Sustainability Risk**
AI infrastructure buildout could plateau faster than expected if:
- GenAI adoption slows or fails to demonstrate ROI justifying current investment levels
- Hyperscaler CapEx moderates after 2026 buildout phase
- Architectural innovations reduce memory intensity per AI workload

**Counterpoint:** Even if AI slows, conventional data center, PC, and smartphone memory demand has normalized, creating more diversified revenue base than during past cycles.

### **2. Supply Response & Cycle Risk**
All three major players are aggressively expanding capacity:
- SK Hynix: $12.9B investment in new fab [Benzinga - Jan 13, 2026](https://www.benzinga.com/node/49868327)
- Samsung: Ramping HBM production, capital intensity increasing
- Micron: $20B FY2026 CapEx

**Risk:** New capacity coming online in 2027-2028 could trigger oversupply, particularly if demand normalizes. Memory industry's boom-bust history suggests caution around peak pricing/margins.

**Magnitude:** Previous memory downturns (2019-2023) saw gross margins compress from 45-50% to negative territory. Current 56-68% margins have meaningful downside if cycle turns.

### **3. Competitive Positioning in HBM**
SK Hynix's 61% HBM market share vs. Micron's 20% creates competitive vulnerability:
- SK Hynix secured OpenAI as customer; Micron customer list less clear
- Technology gap: if SK Hynix maintains leadership in next-gen HBM, could pressure Micron's pricing/share
- Samsung's recent HBM4 progress suggests intensifying competition for Micron's #2/#3 position

### **4. Geopolitical & Trade Policy Risks**
- **Tariff exposure:** Guidance explicitly excludes "any impacts that may occur due to potential new tariffs" [Factset Transcripts - Dec 17, 2025](https://app.bigdata.com/files#?document=380D565223B1B02F9D38FA98159DD34C)
- **China restrictions:** May 2023 CAC ban on Micron products for critical infrastructure in China remains in effect [SEC Form 10-Q - Dec 18, 2025](https://www.sec.gov/Archives/edgar/data/723125/000072312525000046/mu-20251127.htm)
- **Export controls:** Ongoing Section 232 investigation into semiconductor imports could result in industry-wide tariffs/restrictions
- **Supply chain:** Rare earth materials export restrictions from China could constrain manufacturing

**Quantification:** China represented ~10% of revenue pre-ban; loss largely offset by demand elsewhere but represents structural revenue ceiling.

### **5. Valuation Risk**
At 31.5x P/E (TTM) and 8.8x P/S vs. historical ranges of 10-15x P/E and 2-4x P/S, Micron trades at significant premium. Stock up 242% in past year reflects much good news already priced in.

**Downside scenario:** If FY2027 sees cycle normalization, reverting to 15x P/E on $12-15 EPS would imply $180-225 stock price (-33% to -46% from current levels).

---

## **KEY METRICS TO WATCH**

### **Earnings Call Focus Areas**

**1. Q2 Results vs. Guidance**
- **Revenue execution:** Beating high end of $18.3-19.1B range would signal continued demand strength
- **Gross margin:** Exceeding 69% would confirm pricing power persists; falling below 67% would raise concerns about competitive pressure
- **Operating expenses:** $1.38B target; discipline here critical as revenue scales

**2. Full-Year FY2026 Outlook Updates**
- **Revenue range:** Current street at ~$76B for FY2026; any upward revision signals confidence
- **CapEx confirmation:** Reaffirming ~$20B CapEx validates multi-year investment thesis
- **FCF generation:** Management has guided for "significantly higher free cash flow year over year in fiscal 2026"

**3. HBM & Data Center Metrics**
- **HBM revenue disclosure:** Any quantification of HBM contribution (currently undisclosed)
- **Data center revenue growth:** Sequentially and YoY trends
- **Customer diversification:** Progress on design wins with additional AI accelerator vendors beyond Nvidia

**4. Pricing Environment Commentary**
- **Q3 pricing outlook:** Whether ASP increases continue at ~10%+ QoQ or begin moderating
- **Conventional DRAM/NAND trends:** Impact of capacity reallocation on non-AI products
- **Contract vs. spot pricing mix:** Shift toward contracted supply enhances revenue visibility

**5. Competitive Positioning**
- **Market share commentary:** Particularly in HBM vs. SK Hynix/Samsung
- **Technology roadmap:** Updates on next-generation DRAM/NAND nodes
- **Customer feedback:** Especially regarding U.S. manufacturing preference

**6. Risk Factors**
- **Tariff/trade policy:** Contingency plans if new tariffs implemented
- **China exposure:** Any change to CAC restrictions or workarounds
- **Demand signals:** Commentary on hyperscaler CapEx plans, enterprise IT spending, PC/smartphone markets

**7. Capital Allocation**
- **FY2027 CapEx preliminary views:** Sustainability of current investment pace
- **Shareholder returns:** Potential for buyback authorization increases or dividend raises if FCF exceeds investment needs

---

## **ANALYST CONSENSUS & SENTIMENT**

### **Rating Distribution (68 analysts)**
- **Buy:** 55 (81%)
- **Hold:** 11 (16%)
- **Sell:** 2 (3%)
- **Consensus:** Strong Buy

### **Price Target**
- **Consensus:** $323.82 (-3% from current)
- **High:** $450 (+35%)
- **Low:** $190 (-43%)
- **Median:** $325 (-2%)

### **Recent Analyst Actions**
**Rosenblatt (Kevin Cassidy):** Raised estimates "substantially" pre-earnings, called Q1 a "record quarter" with more records ahead [Benzinga - Dec 16, 2025](https://www.benzinga.com/node/49437890)

**JP Morgan (Harlan Sur):** Reaffirmed bullish stance post-management meetings, highlighted "AI-driven memory squeeze" with demand exceeding supply beyond 2026 [Benzinga - Jan 8, 2026](https://www.benzinga.com/node/49797020)

**KB Securities:** Raised SK Hynix target citing "sharply upgraded operating profit forecasts tied to rising DRAM and NAND prices" - positive read-through for Micron [Yahoo Finance - Jan 14, 2026](https://au.finance.yahoo.com/news/memory-cycle-just-begun-analyst-172409417.html)

---

## **AREAS OF UNCERTAINTY & DEBATE**

### **1. Cycle Peak Timing**
**The Debate:** Have we already seen peak pricing/margins, or is there further upside?

**Bull View:** Supply constraints extending beyond 2026 + multi-year AI infrastructure buildout = sustained elevated pricing through FY2027. Historical cycles don't apply given structural demand shift.

**Bear View:** Q1 saw most aggressive sequential pricing gains (+55-60%); Q2 moderating to +10-12% suggests peak rates behind us. New capacity in 2027 will pressure pricing regardless of demand.

**Resolution Watch:** Q2 results and Q3 pricing commentary will be critical. If ASP growth remains 10%+ sequentially, bull case strengthens. If it falls to mid-single digits, bears gain credibility.

### **2. HBM Competitive Position Sustainability**
**The Debate:** Can Micron maintain/grow 20% HBM share against SK Hynix's 61%?

**Bull View:** Micron's technology roadmap (HBM4 shipping in calendar 2026) is competitive. Customer desire for supply diversification + U.S. manufacturing preference creates structural demand for Micron HBM. Full 2026 capacity sold indicates customer confidence.

**Bear View:** SK Hynix's scale advantage (3x Micron's HBM share) creates self-reinforcing technology and cost leadership. Micron's 20% share may represent ceiling absent major SK Hynix missteps.

**Resolution Watch:** Any customer win announcements (especially with major cloud providers/AI chip vendors). Market share data in subsequent quarters. Technology roadmap updates vs. competitors.

### **3. Geopolitical Risk Quantification**
**The Debate:** How material are tariff/trade policy risks to the investment case?

**Bull View:** Guidance excludes tariff impacts, but Micron's U.S. manufacturing base and diversified global footprint provides flexibility. CHIPS Act incentives offset increased costs. Most revenue from U.S./European customers less sensitive to China tensions.

**Bear View:** Section 232 semiconductor investigation could lead to industry-wide tariffs/restrictions. Supply chain dependencies on Asia (equipment, materials) create vulnerability. China ban already cost ~10% revenue that wasn't fully replaced.

**Resolution Watch:** Section 232 investigation outcomes (expected 2026). Any new Trump administration trade policy announcements. Management commentary on mitigation strategies.

### **4. Capital Intensity Sustainability**
**The Debate:** Is $20B FY2026 CapEx sustainable, and what does it mean for returns?

**Bull View:** Investment targeting multi-year AI demand wave generates attractive returns. Management pulled forward Idaho fab (demand signal), suggesting confidence. FCF positive even with elevated CapEx demonstrates earnings power.

**Bear View:** $20B CapEx is 26% of guided FY2026 revenue vs. historical 15-20%. If cycle normalizes in FY2027, return on invested capital could disappoint. Risk of industry overcapacity from all players investing simultaneously.

**Resolution Watch:** FY2027 CapEx preliminary guidance. Free cash flow generation vs. CapEx through FY2026. Return on invested capital trends.

### **5. Sustainability of PC/Consumer Demand**
**The Debate:** Is the PC refresh cycle durable or a one-time post-COVID replacement?

**Bull View:** AI-enabled PCs driving upgrade cycle (Windows Copilot+ PCs). Installed base aging supports multi-year replacement demand. Management raised CY2025 PC growth forecast to high-single-digit (from mid-single-digit), indicating sustained momentum.

**Bear View:** PC TAM structurally declining as users shift to mobile devices. Enterprise refresh cycles are lumpy. Consumer spending under pressure from inflation could dampen upgrade appetite.

**Resolution Watch:** PC unit shipment data. Consumer sentiment indicators. Management commentary on PC business unit trends.

---

## **VALUATION ANALYSIS**

### **Current Valuation Metrics**
- **P/E (TTM):** 31.5x vs. 5-year avg of 15x, sector median of 25x
- **Forward P/E:** 12.4x (Q1 FY2026) based on consensus FY2026 EPS of $27
- **P/S:** 8.8x vs. 5-year avg of 3.5x
- **EV/EBITDA:** 16.8x vs. 5-year avg of 12x
- **P/B:** 6.4x vs. 5-year avg of 2.5x

### **Valuation Framework**

**Scenario Analysis (12-month price targets):**

| Scenario | Probability | FY2027 EPS | P/E Multiple | Price Target | Return |
|----------|-------------|------------|--------------|--------------|--------|
| **Bull Case** | 30% | $35 | 20x | $700 | +110% |
| **Base Case** | 50% | $28 | 15x | $420 | +26% |
| **Bear Case** | 20% | $18 | 12x | $216 | -35% |

**Weighted Average Target:** $437 (+31% upside)

**Bull Case Assumptions:**
- Pricing strength persists through FY2027
- HBM market reaches $80B by 2027 (ahead of $100B 2028 target)
- Gross margins sustain 62-68% range
- PC/smartphone markets exceed expectations
- Minimal tariff/trade policy impacts

**Base Case Assumptions:**
- Pricing moderates but remains elevated (DRAM +5-10% in FY2027)
- HBM market grows to $65B in 2027
- Gross margins normalize to 55-60% range
- Traditional memory markets stable
- Manageable tariff/trade policy impacts

**Bear Case Assumptions:**
- Memory cycle peaks in Q2 FY2026; pricing declines in FY2027
- New capacity triggers oversupply concerns
- Gross margins compress toward 40-45%
- AI infrastructure buildout slows
- Significant tariff/trade policy headwinds

### **Relative Valuation**

**Vs. Memory Peers:**
| Company | P/E (TTM) | Forward P/E | P/S | EV/EBITDA |
|---------|-----------|-------------|-----|-----------|
| Micron | 31.5x | 12.4x | 8.8x | 16.8x |
| SK Hynix | ~25x* | ~11x* | ~7x* | ~15x* |
| Samsung | ~18x* | ~10x* | ~2x* | ~8x* |

*Estimates based on market data and recent earnings

**Assessment:** Micron trades at premium to peers on TTM basis (reflecting FY2026 earnings ramp), but roughly in line on forward basis. Premium justified by U.S. exposure, technology leadership, and superior execution track record.

---

## **SOURCES**

This analysis incorporates data from:
- **Bigdata.com tearsheet and search** - Financial data, analyst estimates, company filings
- **Quartr Transcripts & Presentations** - Q1 FY2026 earnings call, presentation materials
- **FactSet Transcripts** - Management commentary and Q&A
- **SEC Filings** - 10-K, 10-Q disclosures on risks and operations
- **Industry Research** - TrendForce pricing data, Counterpoint market share
- **Financial News Sources** - Bloomberg, Reuters, CNBC, Korea Herald, Benzinga
- **Analyst Reports** - JP Morgan, Rosenblatt, Citigroup, KB Securities, Morgan Stanley

---

## **RECOMMENDATION**

**Rating:** **BUY**
**12-Month Price Target:** $437 (+31% upside)
**Risk Rating:** Medium-High

### **Investment Rationale**

Micron represents a compelling opportunity to capture the AI-driven memory supercycle at an attractive entry point relative to fundamental earnings power. While the stock has appreciated significantly (+242% in past year), the forward P/E of 12.4x based on FY2026 consensus is reasonable given:

1. **Revenue visibility through 2026** with all HBM capacity sold and multi-year contracts under discussion
2. **Structural demand drivers** (AI infrastructure, data center buildout) with multi-year duration
3. **Unprecedented pricing environment** with supply constraints extending beyond 2026
4. **Margin expansion trajectory** from 56% (Q1) to 68% (Q2 guide) with further upside potential
5. **Technology & execution leadership** vs. peers demonstrated by 11 consecutive quarters of beats

### **Risk-Adjusted Return Profile**

Using scenario probability-weighted analysis:
- **Expected return:** +31% (weighted average of bull/base/bear cases)
- **Downside protection:** Strong balance sheet, net cash position, diversified end markets limit bear case probability
- **Upside asymmetry:** If AI buildout sustains through FY2027-2028 as HBM TAM data suggests, bull case (+110%) has material probability

### **For Conservative Investors**
Wait for Q2 results to confirm guidance execution and assess Q3 pricing outlook. Entry around $300-320 post-earnings provides better risk/reward if any skepticism emerges.

### **For Aggressive Investors**
Current levels ($333) offer opportunity to establish positions ahead of Q2 results that are likely to exceed expectations based on industry pricing data and demand signals. Q1 pattern of significant beats suggests Q2 guidance may prove conservative.

---

**Key Catalysts to Monitor:**
- Q2 FY2026 earnings (March 19, 2026)
- Monthly memory pricing data from TrendForce/DRAMeXchange
- Hyperscaler CapEx announcements (Amazon, Microsoft, Google, Meta)
- Section 232 semiconductor investigation outcomes
- Trump administration trade policy announcements
- Competitor earnings (SK Hynix, Samsung) for industry read-throughs

---

*Disclosure: This report is for informational purposes only and does not constitute investment advice. Past performance does not guarantee future results. Investors should conduct their own due diligence and consult with financial advisors before making investment decisions.*