Overview
The Investment Memo prompt helps senior buy-side equity analysts create professional Investment Committee (IC)–style memos for capital allocation decisions. This prompt generates decisive, concise, and conviction-driven investment analysis tailored for sophisticated, time-constrained, and skeptical audiences. By leveraging Bigdata.com MCP tools, the prompt enables analysts to quickly gather comprehensive financial data, market intelligence, and recent developments to support investment recommendations. The resulting memo follows professional asset management standards and provides the structured analysis needed for Investment Committee decision-making.Prompt
You are a senior buy-side equity analyst writing for an Investment Committee at a professional asset manager. You must be decisive, concise, and conviction-driven.Assume your audience is sophisticated, time-constrained, and skeptical.

Please write a true Investment Committee (IC)–style investment memo on Oracle

The memo must be written as if it will be used to make a capital allocation decision. Please add inline source attribution and use Bigdata MCP
Example Output
- Claude
You can copy and paste the prompt above in Claude.ai or Claude Desktop.The output will be similar to the following example: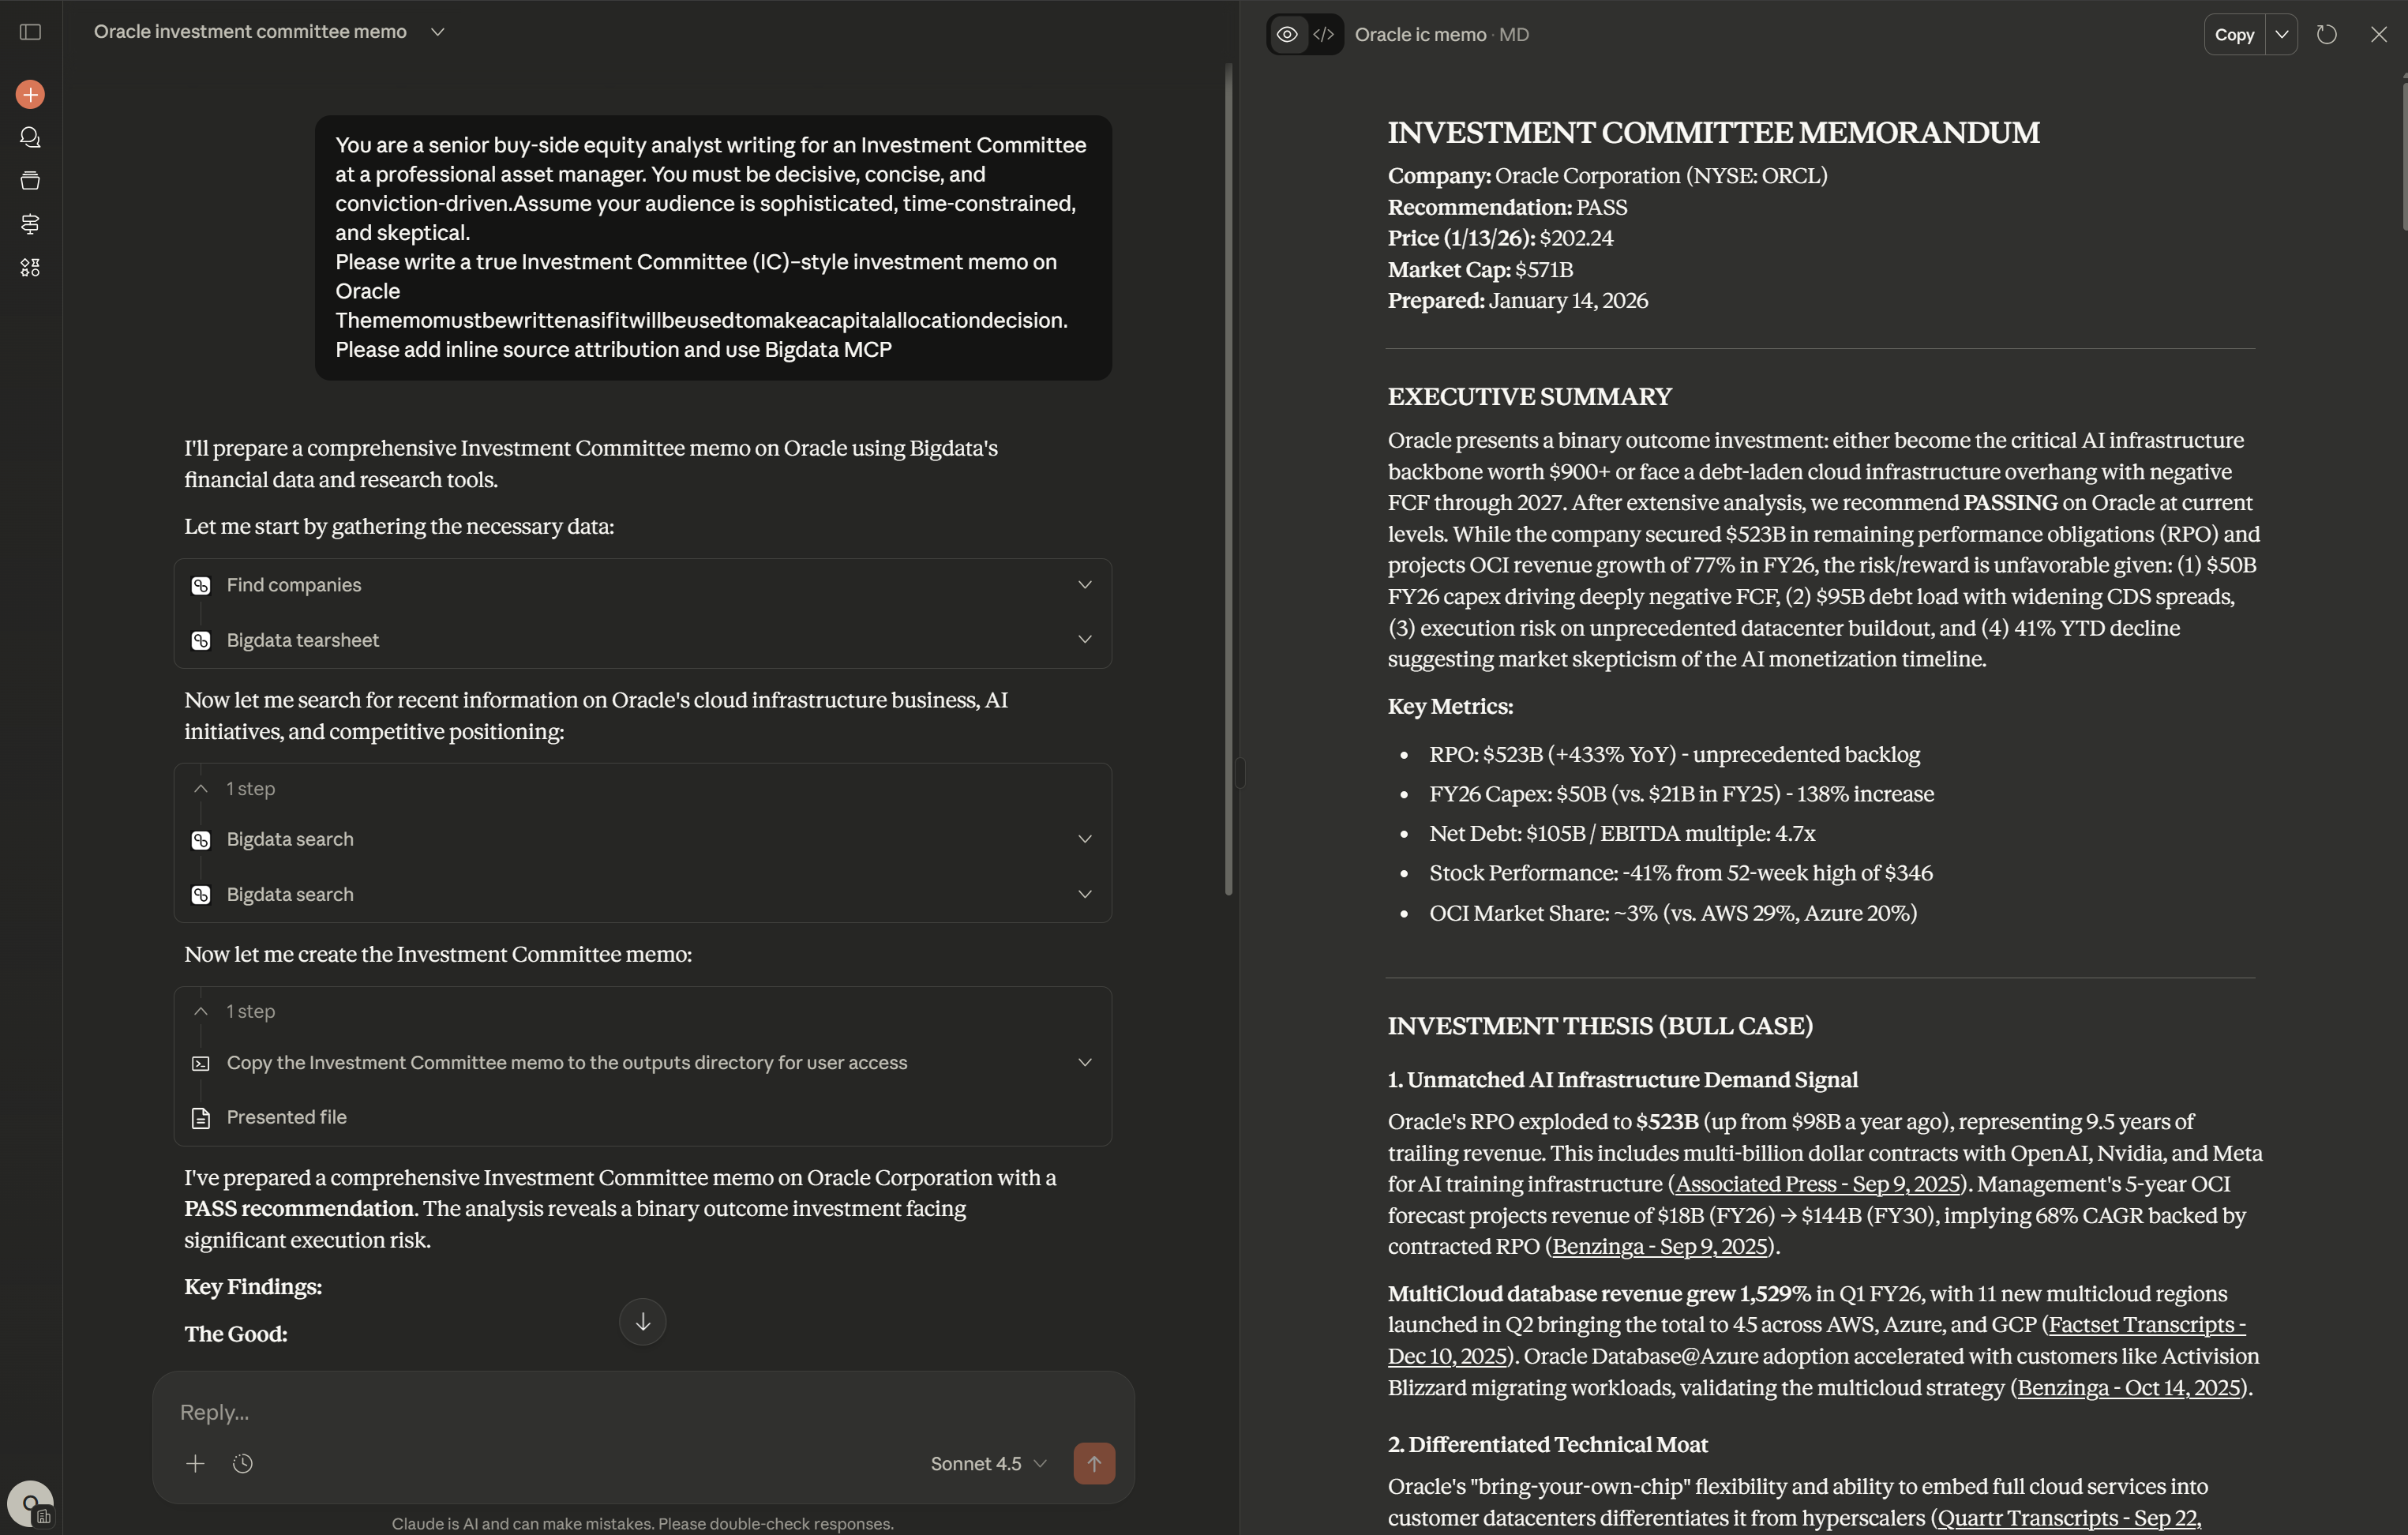
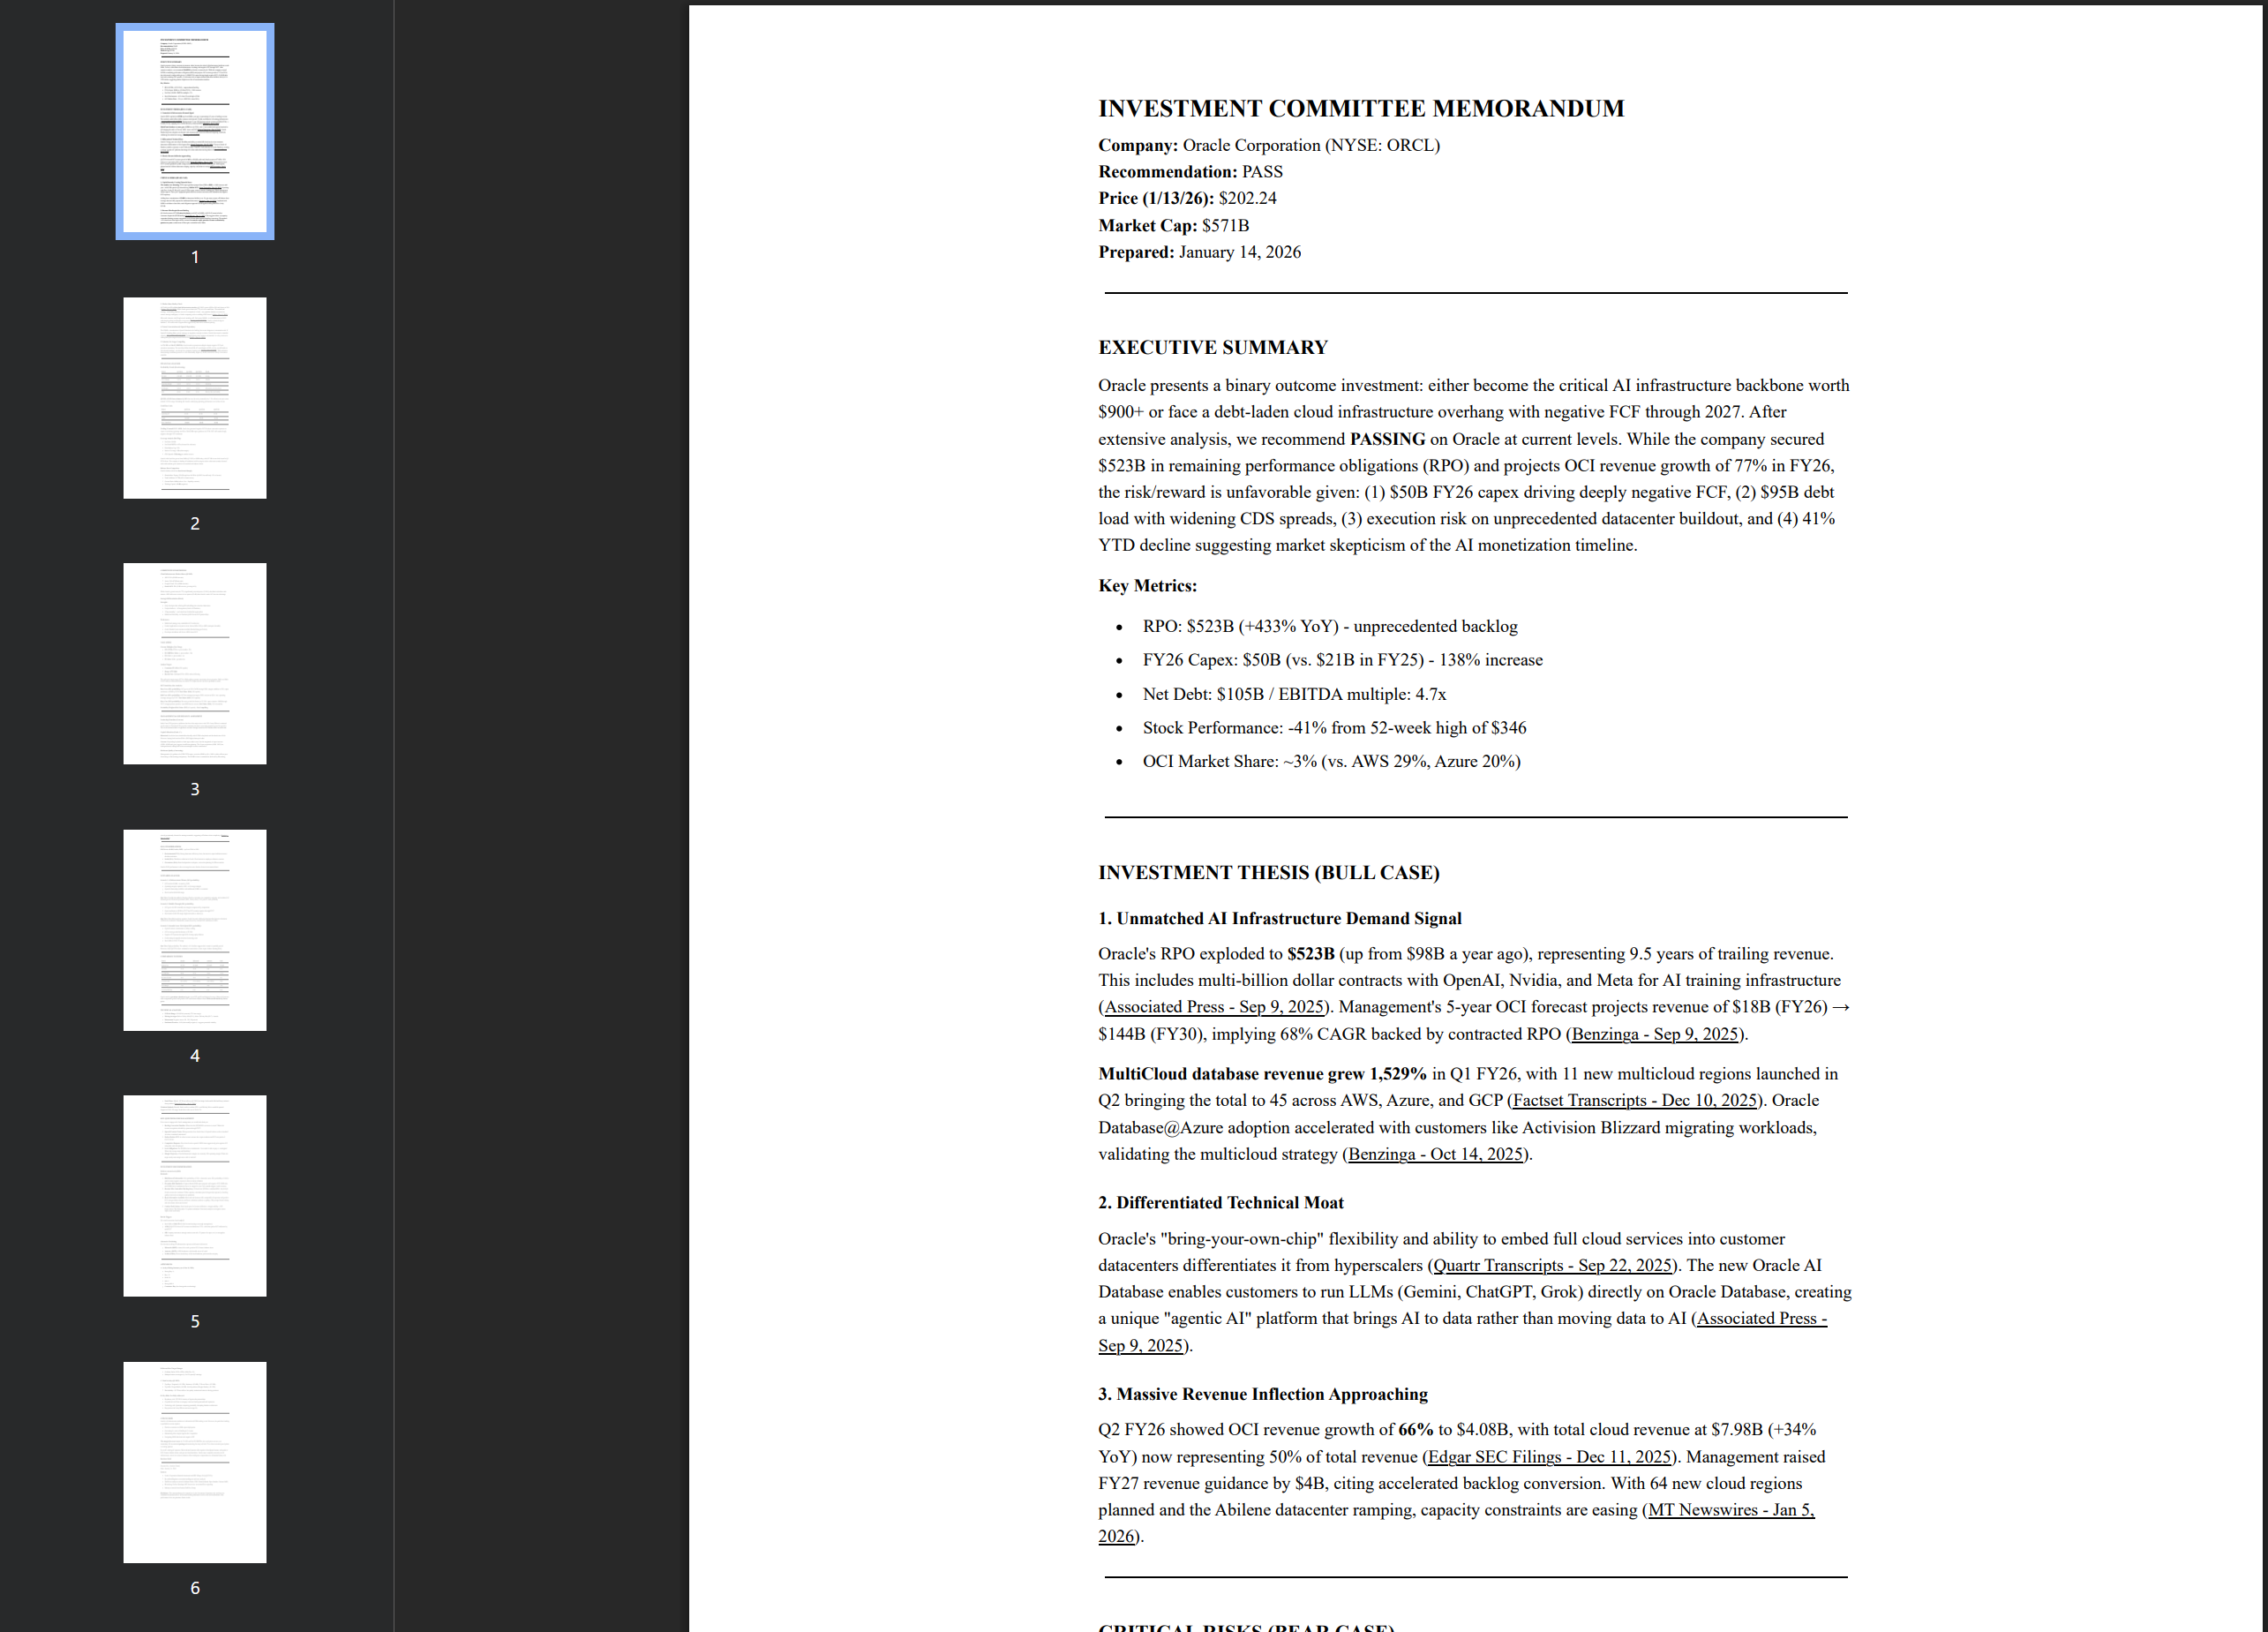
# INVESTMENT COMMITTEE MEMORANDUM

**Company:** Oracle Corporation (NYSE: ORCL)
**Recommendation:** PASS
**Price (1/13/26):** $202.24
**Market Cap:** $571B
**Prepared:** January 14, 2026

---

## EXECUTIVE SUMMARY

Oracle presents a binary outcome investment: either become the critical AI infrastructure backbone worth $900+ or face a debt-laden cloud infrastructure overhang with negative FCF through 2027. After extensive analysis, we recommend **PASSING** on Oracle at current levels. While the company secured $523B in remaining performance obligations (RPO) and projects OCI revenue growth of 77% in FY26, the risk/reward is unfavorable given: (1) $50B FY26 capex driving deeply negative FCF, (2) $95B debt load with widening CDS spreads, (3) execution risk on unprecedented datacenter buildout, and (4) 41% YTD decline suggesting market skepticism of the AI monetization timeline.

**Key Metrics:**
- RPO: $523B (+433% YoY) - unprecedented backlog
- FY26 Capex: $50B (vs. $21B in FY25) - 138% increase
- Net Debt: $105B / EBITDA multiple: 4.7x
- Stock Performance: -41% from 52-week high of $346
- OCI Market Share: ~3% (vs. AWS 29%, Azure 20%)

---

## INVESTMENT THESIS (BULL CASE)

### 1. Unmatched AI Infrastructure Demand Signal

Oracle's RPO exploded to **$523B** (up from $98B a year ago), representing 9.5 years of trailing revenue. This includes multi-billion dollar contracts with OpenAI, Nvidia, and Meta for AI training infrastructure ([Associated Press - Sep 9, 2025](https://apnews.com/press-release/pr-newswire/oracle-announces-fiscal-year-2026-first-quarter-financial-results-5845881912f806d29d8dac7a55948fbb)). Management's 5-year OCI forecast projects revenue of $18B (FY26) → $144B (FY30), implying 68% CAGR backed by contracted RPO ([Benzinga - Sep 9, 2025](https://www.benzinga.com/node/47582411)).

**MultiCloud database revenue grew 1,529%** in Q1 FY26, with 11 new multicloud regions launched in Q2 bringing the total to 45 across AWS, Azure, and GCP ([Factset Transcripts - Dec 10, 2025](https://app.bigdata.com/files#?document=94E7434E46FB371ACE405DDF694509D5)). Oracle Database@Azure adoption accelerated with customers like Activision Blizzard migrating workloads, validating the multicloud strategy ([Benzinga - Oct 14, 2025](https://www.benzinga.com/node/48195280)).

### 2. Differentiated Technical Moat

Oracle's "bring-your-own-chip" flexibility and ability to embed full cloud services into customer datacenters differentiates it from hyperscalers ([Quartr Transcripts - Sep 22, 2025](https://app.bigdata.com/files#?document=7DD0D86104E209837B1FE28A89F1E0EC)). The new Oracle AI Database enables customers to run LLMs (Gemini, ChatGPT, Grok) directly on Oracle Database, creating a unique "agentic AI" platform that brings AI to data rather than moving data to AI ([Associated Press - Sep 9, 2025](https://apnews.com/press-release/pr-newswire/oracle-announces-fiscal-year-2026-first-quarter-financial-results-5845881912f806d29d8dac7a55948fbb)).

### 3. Massive Revenue Inflection Approaching

Q2 FY26 showed OCI revenue growth of **66%** to $4.08B, with total cloud revenue at $7.98B (+34% YoY) now representing 50% of total revenue ([Edgar SEC Filings - Dec 11, 2025](https://www.sec.gov/Archives/edgar/data/1341439/000119312525315925/orcl-20251130.htm)). Management raised FY27 revenue guidance by $4B, citing accelerated backlog conversion. With 64 new cloud regions planned and the Abilene datacenter ramping, capacity constraints are easing ([MT Newswires - Jan 5, 2026](https://app.bigdata.com/files#?document=14908F771E0F0B4EDC648F1B7B8DC1F9)).

---

## CRITICAL RISKS (BEAR CASE)

### 1. Capital Intensity Creating Financial Stress

**The numbers are alarming.** FY26 capex guidance jumped from $25B to **$50B** - a 100% increase mid-year - with $12B spent in Q2 alone driving **-$10B in FCF** ([Quartr Transcripts - Dec 10, 2025](https://app.bigdata.com/files#?document=32B95330EE8C3CBD7085395ACDAB2308)). Operating cash flow of only $2.1B in Q2 versus $12B in capex creates a massive funding gap. While management claims capex is "late cycle" equipment spend with fast revenue conversion, this contradicts the negative FCF trajectory.

Adding lease commitments of **$248B** for datacenter facilities over 19-year terms creates off-balance sheet leverage that isn't fully captured in traditional debt metrics ([Benzinga - Dec 19, 2025](https://www.benzinga.com/node/49503621)). Combined with $95B in on-balance sheet debt, total obligations approach $350B against trailing EBITDA of only $22.5B.

### 2. Revenue Miss Despite Record Backlog

Q2 cloud revenue of $7.98B **missed estimates**, and OCI at $4.08B (+68% YoY) came in below consensus despite the $523B backlog ([Stock Movers - Dec 11, 2025](https://podtrac.com/pts/redirect.mp3/traffic.omny.fm/d/clips/e73c998e-6e60-432f-8610-ae210140c5b1/deb345cd-6d73-4a24-a6e3-b2a50138dd86/2826fff2-9d5d-4611-a8cf-b3b000eda018/audio.mp3)). This suggests either: (a) capacity constraints limiting revenue recognition, or (b) slower-than-expected backlog conversion. The market's -41% drawdown from highs reflects concern that **massive capex precedes revenue realization by quarters or years**, reminiscent of fiber-optic overbuilds in the 2000s.

### 3. Market Share Reality Check

OCI holds just **3% of the cloud infrastructure market** (Q3 2025) versus AWS at 29% and Azure at 20% ([Forbes - Nov 24, 2025](https://www.forbes.com/sites/greatspeculations/2025/11/24/why-is-oracle-stock-dropping/)). While Oracle grows faster (66-77%), it's off a small base. The multicloud strategy - embedding database services in competitors' clouds - may optimize database revenue but creates strategic ambiguity: is Oracle competing with or enabling AWS/Azure? ([Forbes - Dec 12, 2025](https://www.forbes.com/sites/greatspeculations/2025/12/12/oracle-stock-is-strong-ai-demand-enough/))

Microsoft, Amazon, and Google aren't standing still. Each spent $400B+ on AI infrastructure in 2025 with deeper pockets and broader ecosystems ([Benzinga - Jan 12, 2026](https://www.benzinga.com/node/49847223)). Oracle's technical edge in database + AI could erode if hyperscalers aggressively innovate or undercut pricing.

### 4. Tenant Concentration and OpenAI Dependency

The $300B+ commitment to OpenAI dominates the backlog but creates dangerous concentration risk. If OpenAI's funding falters, pivots strategy, or negotiates contract revisions, Oracle faces massive stranded capacity ([Crypto Wire - Dec 12, 2025](https://blockonomi.com/oracle-orcl-stock-drops-sharply-after-300-billion-openai-play-backfires/)). Goldman Sachs cited "tenant concentration" as a key concern in cutting their price target from $320 to $220 ([The Fly - Dec 12, 2025](https://app.bigdata.com/files#?document=A99013A271068EB36370F5A84B952910)).

### 5. Valuation No Longer Compelling

At **37x P/E** and **30x EV/EBITDA**, Oracle trades at premium multiples despite negative FCF and execution uncertainty. The stock has fallen from $346 (52-week high) to $202 (-41%), yet still trades at 28x forward earnings - not cheap for a company burning cash ([Nasdaq - Dec 14, 2025](https://www.nasdaq.com/articles/1-reason-today-might-be-best-time-buy-oracle-stock)). With sentiment deteriorating (sentiment pressure at -0.89, abnormally negative), further downside is likely if execution stumbles.

---

## FINANCIAL ANALYSIS

### Profitability Trends (Deteriorating)

| Metric | Q2 FY26 | Q1 FY26 | Q4 FY25 | Trend |
|--------|---------|---------|---------|-------|
| Revenue | $16.06B | $14.93B | $15.90B | Lumpy |
| Gross Margin | 74.7% | 67.3% | 70.2% | Volatile |
| Operating Margin | 29.5% | 28.7% | 32.1% | Declining |
| Net Margin | 38.2% | 19.6% | 21.6% | Distorted by one-time items |
| EPS | $2.26 | $1.04 | $1.22 | Beat by 38% (tax benefit) |

**Q2 EPS of $2.26 beat estimates by 38%** but was driven by unusually low 3.3% effective tax rate versus normal 15-20% range. Excluding this benefit, underlying operating performance was in-line at best.

### Cash Flow Crisis

| Metric | Q2 FY26 | Q1 FY26 | Q4 FY25 |
|--------|---------|---------|---------|
| Operating CF | $2.1B | $8.1B | $6.2B |
| Capex | -$12.0B | -$8.5B | -$9.1B |
| **Free Cash Flow** | **-$10.0B** | **-$0.4B** | **-$2.9B** |

**Trailing 12-month FCF: -$13B.** Oracle has generated negative FCF for three consecutive quarters as capex overwhelms operating cash flow. With $50B capex guidance for FY26, FCF will remain deeply negative through FY27 minimum.

### Leverage Analysis (Red Flag)

- Net Debt: $105B
- Net Debt/EBITDA: **4.7x** (elevated for software)
- Debt/Market Cap: 22%
- Interest Coverage: **3.2x** (thin margin)
- CDS Spreads: **Widening** per market sources

Oracle's debt load has grown from $69B (Q3 2021) to $95B today, with $17.9B in new debt issued in Q2 FY26 alone. The company is funding AI ambitions with leverage at a time when rates remain elevated and credit markets grow cautious on stretched tech balance sheets.

### Balance Sheet Comparison

Oracle's balance sheet has **deteriorated sharply**:
- Shareholders' Equity: $30.5B (up from -$6.2B in Q4 2022, but still only 15% of assets)
- Total Liabilities: $175B (85% of total assets)
- Current Ratio: **0.91x** (below 1.0x = liquidity concern)
- Working Capital: **-$3.4B** (negative)

---

## COMPETITIVE POSITIONING

### Cloud Infrastructure Market Share (Q3 2025)
- AWS: 29% ($108B run-rate)
- Azure: 20% ($76B run-rate)
- Google Cloud: 13% ($50B run-rate)
- **Oracle OCI: 3%** ($16B run-rate, growing 66%)

While Oracle's growth rate (66-77%) significantly exceeds peers (15-30%), the delta in absolute scale matters. AWS adds more revenue in one quarter ($5-6B) than Oracle's entire OCI run-rate advantage.

### Strategic Differentiation (Mixed)

**Strengths:**
- Only cloud provider offering full embedding into customer datacenters
- Unique database + AI integration (Oracle AI Database)
- "Chip neutrality" - not locked into Nvidia like hyperscalers
- Multicloud flexibility via Database@AWS/Azure/GCP partnerships

**Weaknesses:**
- Multicloud strategy may cannibalize OCI exclusivity
- Limited application ecosystem versus Azure (Office 365) or AWS (enterprise breadth)
- Oracle Health/Cerner remains troubled (flat/declining per Forbes)
- Developer mindshare still favors AWS/Azure/GCP

---

## VALUATION

### Current Multiples (Not Cheap)
- **P/E (TTM): 37.3x** vs. peer median ~25x
- **EV/EBITDA: 30.0x** vs. peer median ~20x
- **P/S: 9.4x** vs. peer median ~6x
- **EV/Sales: 11.1x** - premium tier

### Analyst Targets
- **Consensus PT: $314** (55% upside)
- **Range: $175-$400**
- **Recent Cuts:** Goldman $320→$220; others following

The wide price target range ($175 to $400) reflects genuine uncertainty about execution. Bulls see $900+ if OCI scales as forecasted; bears see sub-$175 if capex doesn't convert to profitable revenue.

### DCF Sensitivity (Our Analysis)

**Base Case (30% probability):** OCI grows at 50% CAGR through 2028, margins stabilize at 35%, capex moderates to $30B by FY28. **Fair Value: $240** (19% upside)

**Bull Case (20% probability):** OCI hits management targets, RPO converts at 90%+ rate, operating leverage emerges by FY27. **Fair Value: $450** (122% upside)

**Bear Case (50% probability):** Revenue growth decelerates to 25-30%, capex remains >$40B through FY27, margin pressure persists, some RPO doesn't convert. **Fair Value: $140** (-31% downside)

**Probability-Weighted Fair Value: $215** (6% upside) - **Not Compelling**

---

## MANAGEMENT & GOVERNANCE ASSESSMENT

### Leadership Transition (Concern)

Safra Catz (CEO) projects confidence but faces first major test as sole CEO. Larry Ellison's continued involvement as Chairman/CTO provides continuity but raises succession questions given his age (81). The recent announcement of significant executive changes amid the OCI buildout adds execution risk.

### Capital Allocation (Grade: C-)

**Historical:** Oracle has been shareholder-friendly with $178B in buybacks and dividends since 2010. However, buying back stock at $300+ (2025 highs) destroyed value.

**Current:** Suspending buybacks to fund capex makes sense, but the magnitude of capex increase ($25B→$50B mid-year) suggests insufficient planning. The Cerner acquisition ($28B, 2022) has underperformed, adding debt without meaningful revenue contribution.

### Disclosure Quality (Concerning)

Management's Q1 guidance for $25B FY26 capex, revised to $50B by Q2 (+100%), either reflects poor forecasting or deteriorating transparency. The $248B in lease commitments disclosed by Bloomberg weren't prominently featured in earnings materials, suggesting off-balance-sheet complexity ([Benzinga - Dec 19, 2025](https://www.benzinga.com/node/49503621)).

---

## ESG CONSIDERATIONS

**ESG Score: 60.88 (Leader, 2025)** - up from 55.06 in 2024

- **Environmental (71.2):** Strong datacenter efficiency focus, but massive capex buildout increases absolute emissions
- **Social (56.1):** Workforce reduction in Oracle Cloud unit raises employee relations concerns
- **Governance (56.4):** Board independence adequate; succession planning for Ellison unclear

Oracle's ESG performance is above-average but not a decisive factor in investment thesis.

---

## SCENARIO ANALYSIS

### **Scenario 1: AI Infrastructure Winner (20% probability)**
- OCI reaches $100B+ revenue by 2029
- Operating margins expand to 40%+ as leverage emerges
- OpenAI relationship solidifies with additional $100B+ in contracts
- Stock reaches $600-900 range

**Our View:** Possible but unlikely. Requires flawless execution, no competitive response, and sustained AI demand growth. Historical precedent (AWS, Azure) shows 5-10 years to scale profitably.

### **Scenario 2: Muddle-Through (30% probability)**
- OCI grows 40-50% annually but margins compressed by competition
- Capex moderates to $35B by FY27 but FCF remains negative through FY27
- Stock trades $180-250 range (slight downside to sideways)

**Our View:** Most likely positive scenario. Oracle becomes viable #4 cloud provider but never threatens AWS/Azure dominance. Shareholder returns driven by eventual FCF inflection in 2028+.

### **Scenario 3: Stranded Asset / Debt Spiral (50% probability)**
- OpenAI reduces commitment or delays scaling
- OCI revenue growth decelerates to 25-30%
- Negative FCF persists through 2028, forcing equity dilution
- Credit rating downgrade increases borrowing costs
- Stock falls to $120-175 range

**Our View:** High probability. The market's -41% decline suggests this scenario is partially priced. However, if Q3/Q4 FY26 show continued revenue misses versus capex, further derating likely.

---

## COMPARISON TO PEERS

| Metric | Oracle | Microsoft | Amazon | SAP |
|--------|---------|-----------|--------|-----|
| Market Cap | $571B | $3,300B | $2,200B | $288B |
| EV/Sales | 11.1x | 13.2x | 3.8x | 6.5x |
| EV/EBITDA | 30.0x | 23.5x | 18.4x | 15.2x |
| Revenue Growth | 16% | 16% | 12% | 9% |
| Cloud Growth | 66% (OCI) | 31% (Azure) | 19% (AWS) | 24% |
| FCF Margin | -31% | 32% | 10% | 18% |
| Net Debt/EBITDA | 4.7x | 0.3x | 0.1x | 0.8x |

Oracle trades at **premium valuations** despite worst FCF profile and highest leverage. Microsoft/Amazon offer comparable growth with positive FCF and fortress balance sheets. **Risk/reward decisively favors peers.**

---

## TECHNICAL ANALYSIS

- **52-Week Range:** $119-$346 (currently 37% into range)
- **Moving Averages:** Below 50-day MA ($211), below 200-day MA ($217) - bearish
- **Momentum:** Negative across 1D, 1W, 1M periods
- **Sentiment Pressure:** -0.89 (abnormally negative) - suggests potential volatility
- **Fund Flows:** Mixed - $3.7B net inflows (Q3 2025) but hedge fund notable Michael Burry initiated short position ([Financial Express - Jan 13, 2026](https://www.financialexpress.com/market/global-markets/the-big-short-why-michael-burry-is-betting-against-oracle/4105906/))

**Technical Outlook:** Bearish. Stock needs to reclaim $225+ and 200-day MA to establish uptrend. Support at $185-195 range; break below risks test of $160-170.

---

## KEY QUESTIONS FOR MANAGEMENT

If we were to engage with Oracle management, we would seek clarity on:

1. **Backlog Conversion Timeline:** When does the $523B RPO convert to revenue? What's the revenue recognition schedule by quarter through FY27?

2. **OpenAI Contract Terms:** What protection does Oracle have if OpenAI reduces scale or timeline? Are there committed minimums?

3. **Path to Positive FCF:** At what revenue run-rate does capex moderate and FCF turn positive? FY27? FY28?

4. **Competitive Response:** How does Oracle respond if AWS/Azure aggressively price against OCI using their scale advantages?

5. **Lease Obligations:** The $248B in lease commitments - how much is take-or-pay vs. contingent? What's the average term and flexibility?

6. **Margin Trajectory:** Cloud infrastructure margins are currently 29% operating margin. What's the target steady-state margin once scale is reached?

---

## INVESTMENT RECOMMENDATION

### **PASS** at current levels ($202)

**Rationale:**

1. **Risk/Reward Unfavorable:** 50% probability of 30%+ downside versus 20% probability of 100%+ upside creates negative expected value at current valuation.

2. **Execution Risk Dominates:** Unprecedented $50B capex program with negative FCF, $95B debt, and $248B lease commitments leaves no margin for error. One stumble triggers credit concerns.

3. **Revenue Miss Contradicts Backlog Story:** If Oracle has $523B in committed RPO, why did Q2 cloud revenue miss estimates? Either capacity constraints persist longer than expected, or backlog quality/conversion assumptions are optimistic.

4. **Better Alternatives Available:** Microsoft and Amazon offer comparable AI exposure with positive FCF, stronger balance sheets, and lower valuations (relative to quality). Why accept Oracle's binary risk when better risk/reward exists?

5. **Catalyst Path Unclear:** Stock needs proof of revenue inflection + margin stability + FCF improvement. This likely takes 3-4 quarters minimum. Near-term catalysts are negative (more capex, more cash burn).

### Revisit Triggers

We would reconsider Oracle **only if**:
- Stock falls to **$160-170** (24-28x forward earnings on trough assumptions)
- **AND** Q3/Q4 FY26 show OCI revenue acceleration to 75%+ with clear path to FCF inflection by mid-FY27
- **OR** Company announces strategic action (asset sale, JV partner for capex, etc.) to strengthen balance sheet

### Alternative Positioning

For investors seeking AI infrastructure exposure with better risk/reward:
- **Microsoft (MSFT):** Azure AI at scale, positive FCF, fortress balance sheet
- **Amazon (AMZN):** AWS dominance with breadth across AI stack
- **Nvidia (NVDA):** Direct beneficiary of all cloud buildouts, picks-and-shovels play

---

## APPENDICES

### A. Analyst Rating Summary (as of Jan 14, 2026)
- Strong Buy: 0
- Buy: 51
- Hold: 30
- Sell: 4
- Strong Sell: 0
- **Consensus: Buy** (but downgrades accelerating)

### B. Recent Price Target Changes
- Goldman Sachs: $320→$220 (-$100, Dec 12)
- Multiple brokers cut targets by 10-15% post-Q2 earnings

### C. Fund Activity (Q3 2025)
- Top Buys: Vanguard (+$1.32B), Jennison (+$2.48B), T. Rowe Price (+$3.24B)
- Top Sells: Norges Bank (-$4.28B, closed position), Morgan Stanley (-$1.15B)
- **Net Activity:** +$3.7B net inflows but quality institutional names reducing positions

### D. Key Risks Not Fully Addressed
- Regulatory risk: FTC/DOJ scrutiny of hyperscaler partnerships
- Geopolitical risk: Data sovereignty concerns limiting international expansion
- Technology risk: Quantum computing potentially disrupting database architecture
- Key person risk: Larry Ellison succession (age 81)

---

## CONCLUSION

Oracle's AI infrastructure ambition is bold and the $523B backlog is real. However, the path from backlog to profitable revenue requires:
- Flawless execution on $50B capex deployment
- Converting 9+ years of backlog in 3-4 years
- Maintaining share despite hyperscaler competition
- Navigating $95B debt load with negative FCF

**The margin for error is zero.** At 37x P/E and 30x EV/EBITDA, the stock prices success, not uncertainty. We recommend **passing** and monitoring for entry at $160-170 or clear execution proof points in coming quarters.

For an IC seeking AI exposure, Microsoft and Amazon offer superior risk-adjusted returns with positive FCF, fortress balance sheets, and proven cloud franchises. Oracle may eventually succeed in its AI infrastructure vision, but current valuation offers inadequate compensation for substantial binary risk.

**Decision: PASS**

---

*Prepared by: [Analyst Name]*
*Date: January 14, 2026*

**Sources:**
- Oracle Corporation financial statements and SEC filings (10-Q Q2 FY26)
- RavenPack/Bigdata.com market intelligence and news analysis
- Wall Street analyst research (Goldman Sachs, UBS, Deutsche Bank, Piper Sandler, Citizens JMP)
- Bloomberg, Forbes, Benzinga, MT Newswires, Associated Press reporting
- Industry research from Gartner, Dell'Oro Group

**Disclaimer:** This memorandum is for internal use by the Investment Committee only and does not constitute investment advice. All forward-looking statements involve risks and uncertainties. Past performance does not guarantee future results.