

July 20, 2026
- Bigdata.com ships two sentiment tools from RavenPack’s research stack: a daily trend signal (REST API: backtesting, monitoring, alerts) and a real-time tearsheet (zero code, inside Claude, ChatGPT, and Copilot).
- They answer different questions, what’s the trend? versus what’s driving it right now?: two complementary horizons on the same name, built to be used together.
- Every chart and number below comes from live API calls you can reproduce today.
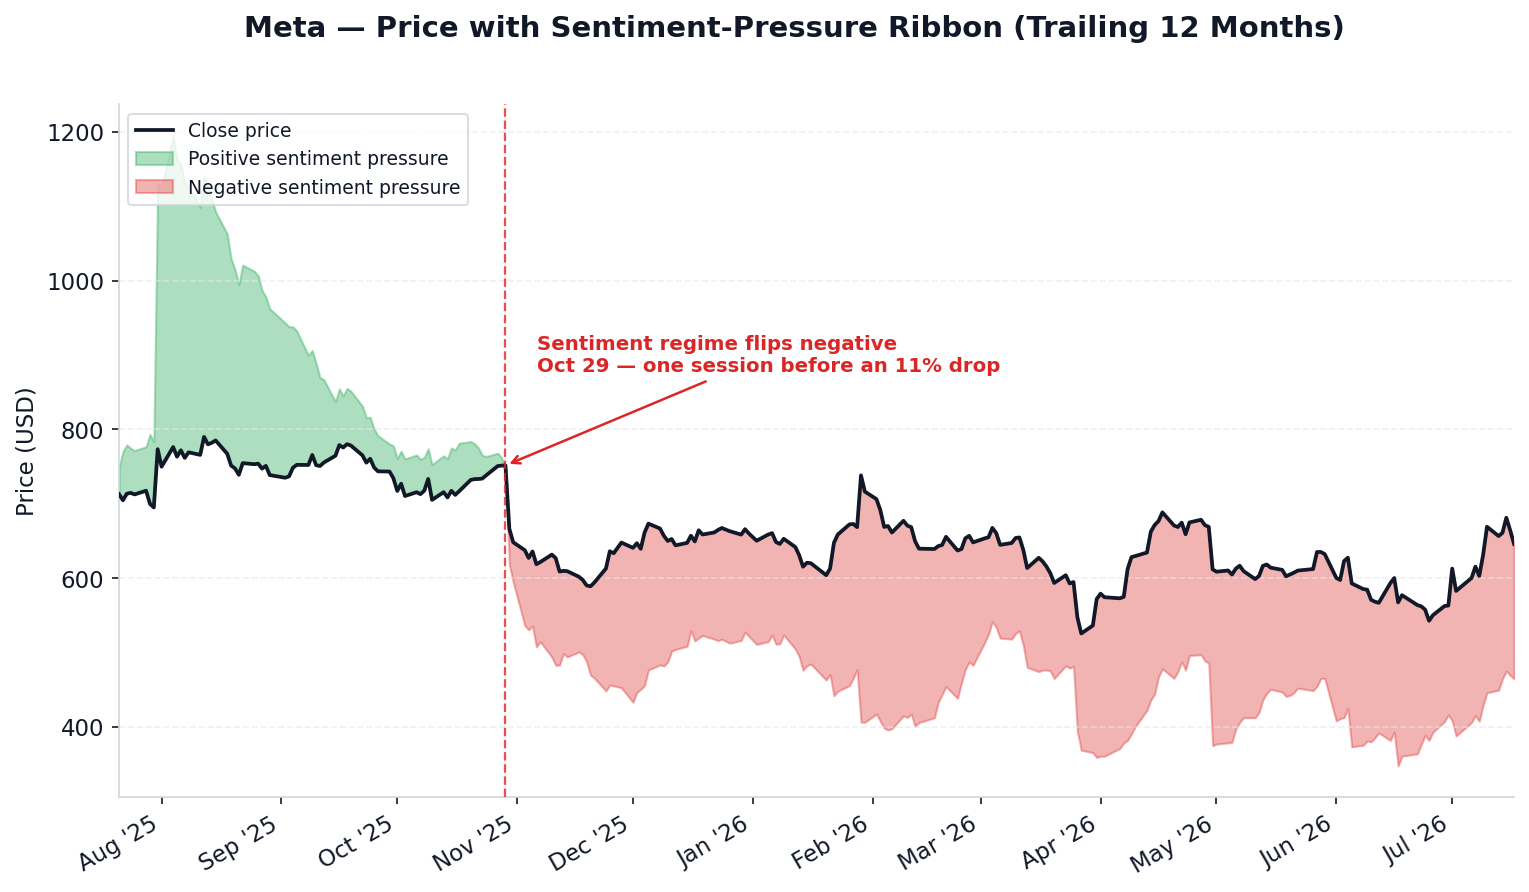
Two tools, two questions
Tool 1: Entity Sentiment API, the trend
The/v1/entity-sentiment/ endpoint returns three signals per entity per day: daily_sentiment (today’s weighted tone), sentiment_pressure (is the 90-day trend unusual for this company), and abnormal_media_attention (is coverage volume unusual). Reach for it to look back over months or years, or to backtest against price.
Daily sentiment is the day’s weighted average of event sentiment, weighted by (relevance/100)² × (novelty/90)²: a highly relevant, novel event counts far more than a marginal or repetitive one.
Sentiment pressure z-scores the 90-day moving average against the company’s own trailing year, normalized to [-1, 1]. Beyond ±0.9 is statistically unusual. It answers: is the recent trend better or worse than this company’s norm?
Abnormal media attention applies the same treatment to coverage volume instead of tone: a bad story spreading and a product launch both spike it, for opposite reasons.
The full EDGE Analytics pipeline (relevance and novelty weighting, bias correction, subsidiary rollup, z-scoring, normalization) ships as one endpoint. None of it is yours to maintain.
identifier.value also accepts a list: one call covers your whole watchlist.
The overlay, across a basket
The same ribbon across eight names over the trailing 12 months, each panel annotated with the correlation between sentiment_pressure and price: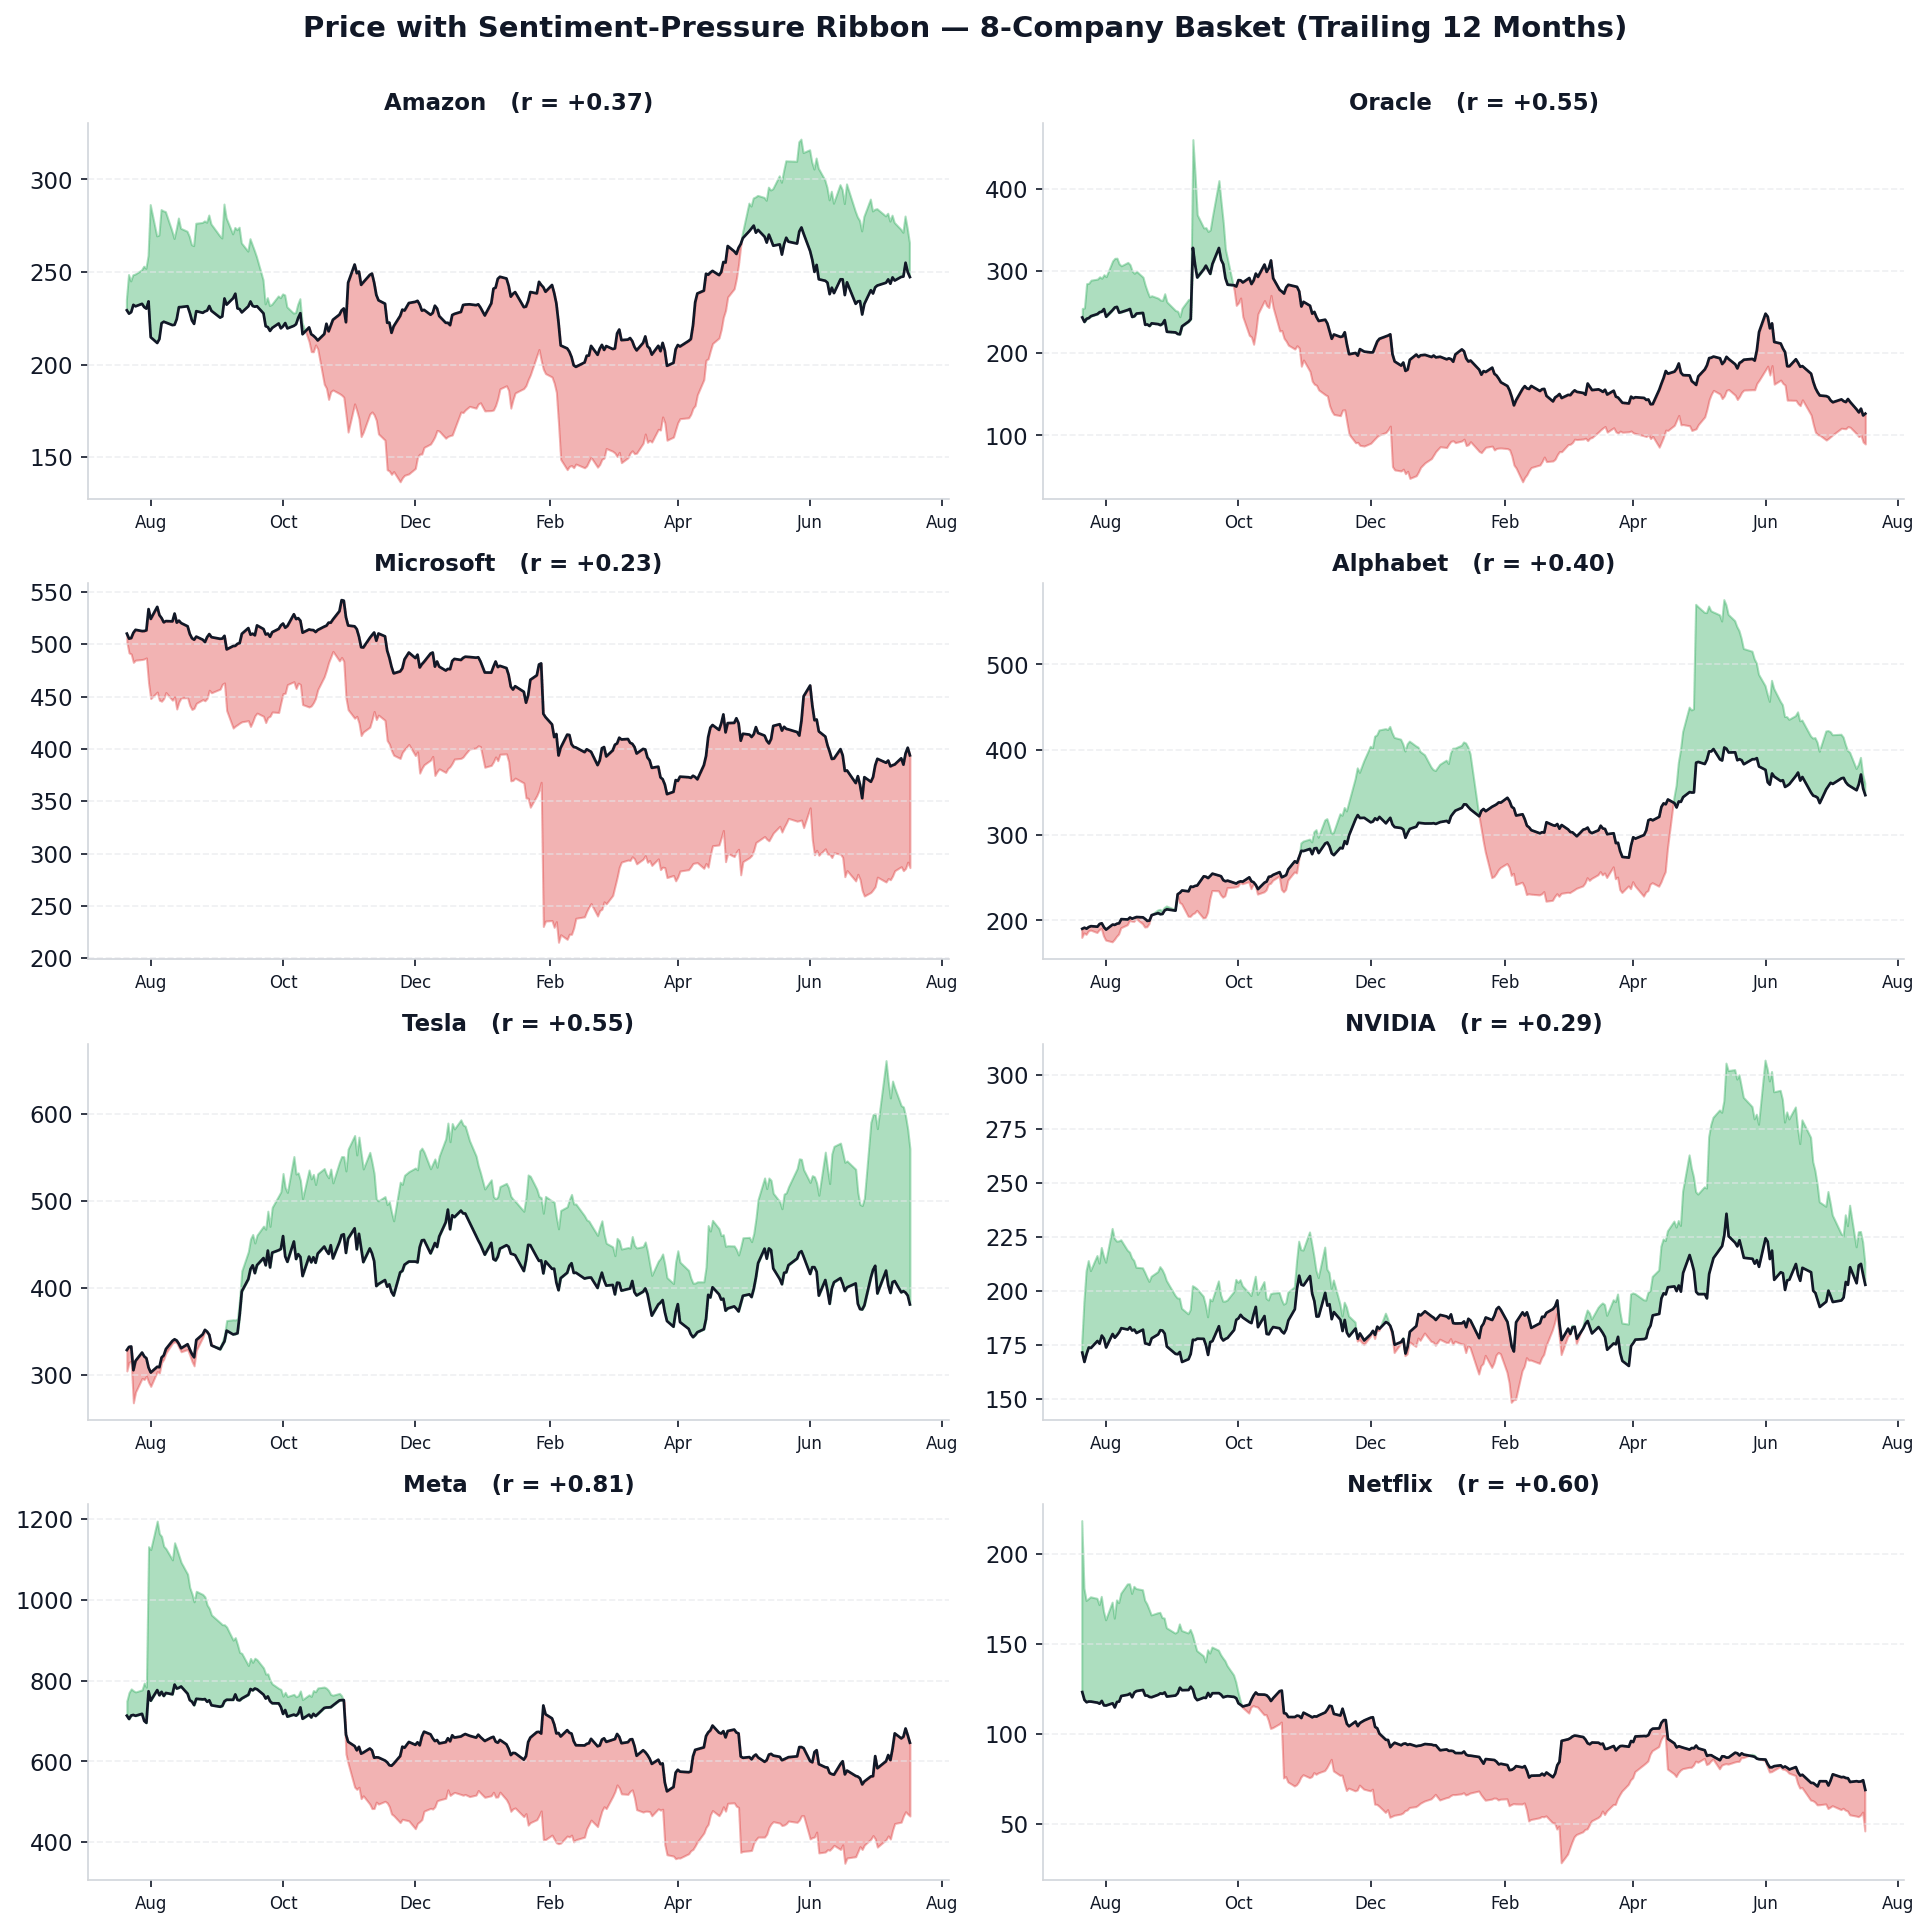
Continuously monitoring private companies
Private companies in the Bigdata.com knowledge graph get the same signals, driven by funding rounds, launches, and regulatory scrutiny instead of earnings cycles. Watch abnormal media attention around SpaceX’s IPO: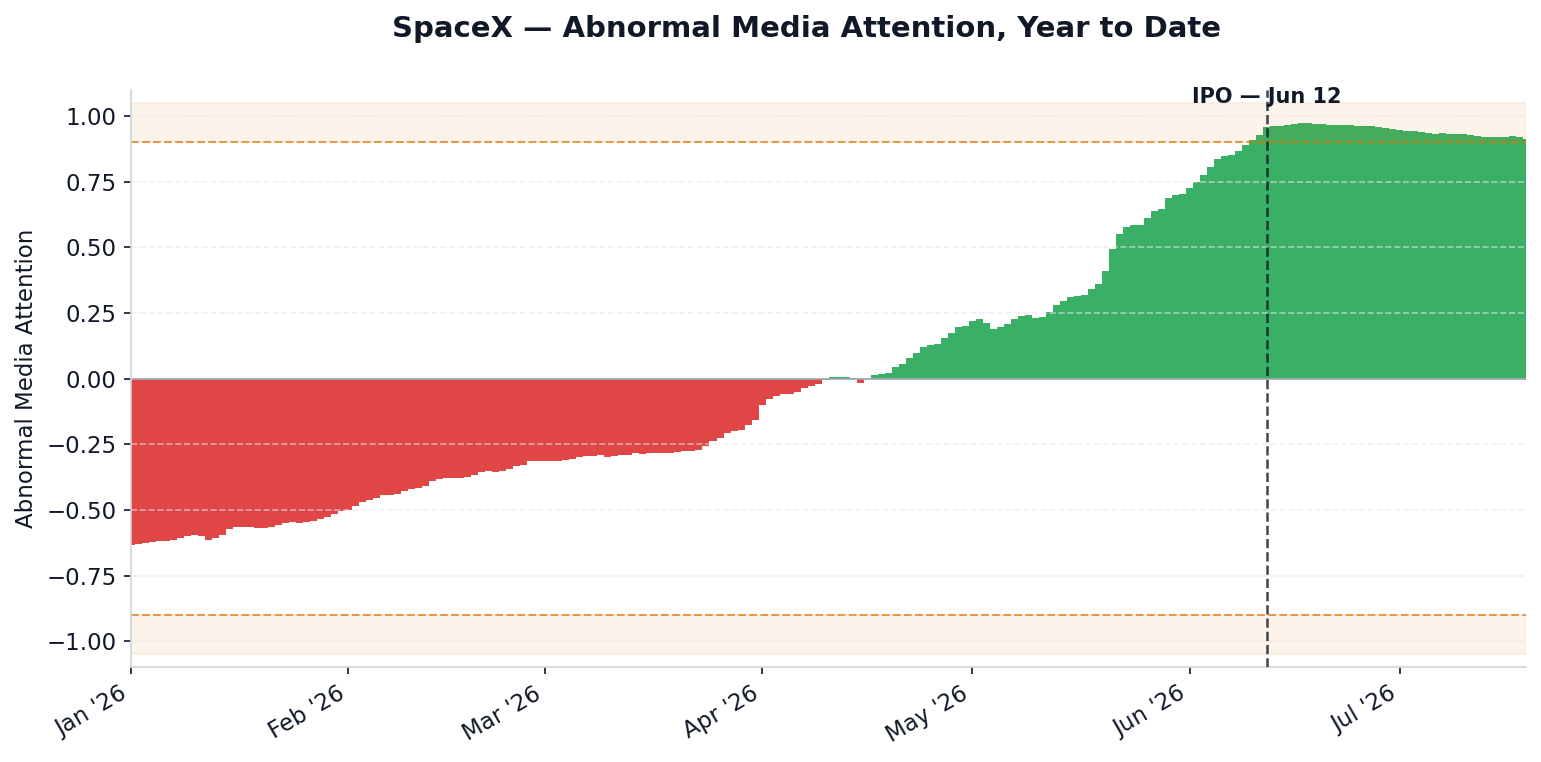
Twenty years of one company’s sentiment
One request covers up to 3,650 data points, about 10 years per entity; stitch calls together for more. Apple’s price with its sentiment-pressure ribbon, weekly, 2006 through today: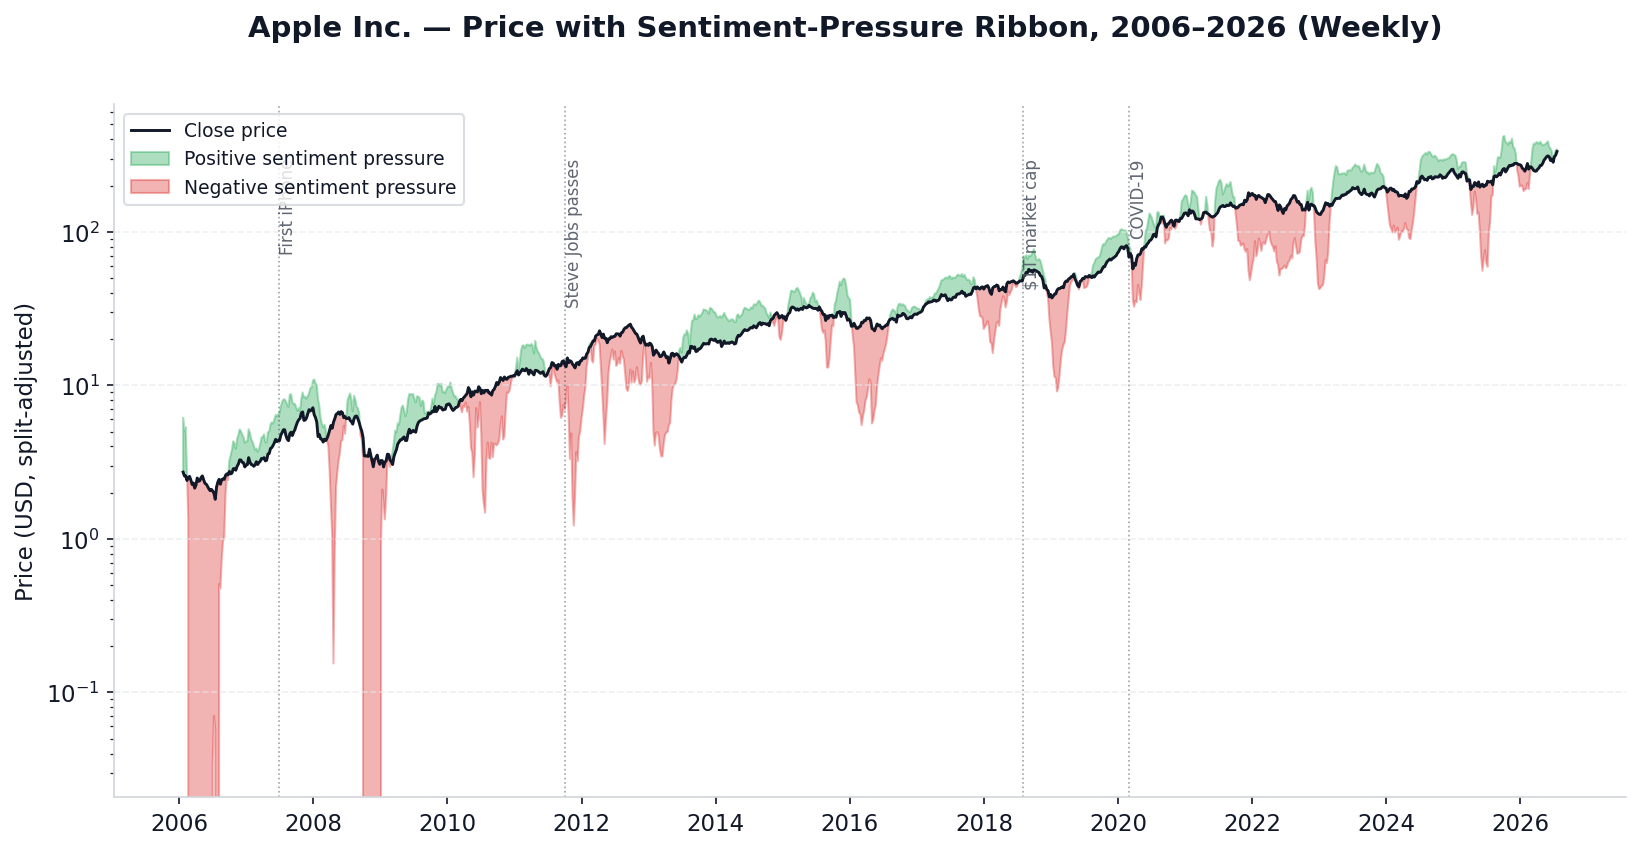
Tool 2: Sentiment Tearsheet, what’s driving it right now
The trend API looks back. When you need to know why a stock is moving today, you want the news itself, ranked by what’s driving the current reading, with a narrative that ties it together. That’s the Sentiment Tearsheet. It lives inside Claude, ChatGPT, and Microsoft Copilot through the Bigdata.com MCP connector. No API key, no code: ask “what’s driving sentiment on SpaceX right now?” and it answers. Its building block is the chunk-level sentiment introduced above, aggregated into a company-level signal. The same scores come back on every Search API result, so anything the tearsheet summarizes you can drill into chunk by chunk. Three design choices keep the signal clean. SEC filings and transcripts are excluded: boilerplate carries systematic sentiment bias, not news. Near-neutral coverage is dropped and strong coverage is weighted by squared magnitude, so the score is decisive. And evidence is ranked by contribution to today’s reading (relevance, magnitude, recency), not raw relevance.SpaceX, called just now
We saw SpaceX through the trend lens earlier. Here it is through the real-time lens, today. Everything below is the tool’s actual output.Summary
SpaceX’s post-IPO equity narrative is dominated by near-term Starship execution setbacks and the resulting market repricing. Multiple reports tie the stock slide to the postponed and aborted Flight 13 and engine ignition issues. Coverage also carries a genuine counterweight in AI compute and supply-chain themes, but the current regime is negative and deteriorating: -0.303 against a -0.175 baseline, momentum -0.129, and a quarterly z-score of -2.2, beyond the ±2 threshold the tool flags as statistically unusual.
Bullish
- Foxconn reported to secure AI server manufacturing order from SpaceX (about USD 52B)
- Quiet build-out of an AI compute rental business: Google, Anthropic, Pentagon deals
- Dip-buying framing emerging: “down 45% from its high, history suggests…”
Risk / Watchlist
- Starship Flight 13 aborted after four engines failed to ignite; retry set for Jul 23
- Stock below its USD 135 IPO price; about USD 1T of market value lost from the post-IPO peak
- FT: traders raising bets against SpaceX; ~30% of the public float shorted
Outlook
The unresolved tension: can Starship execution recover fast enough to restore the post-IPO valuation trajectory, or does the market keep discounting execution variability? Evidence supports both sides; no specific forward view.
Evidence, ranked by contribution to today’s reading (relevance x |sentiment| x recency decay)
| Headline | Source | Date | Sent | Contrib |
|---|---|---|---|---|
| SpaceX stock wobbles after Starship launch postponement | InvestingCube | Jul 20 | −0.79 | −0.53 |
| Weeks after record IPO, SpaceX loses USD 1 trillion in market value | Times of India | Jul 19 | −0.80 | −0.47 |
| SpaceX stock is down 45% from its high; history suggests… | Nasdaq | Jul 20 | +0.83 | +0.44 |
| Foxconn secures AI server contract manufacturing order from SpaceX | Wallstreetcn | Jul 20 | +0.82 | +0.38 |
| Four engines fail to ignite, forcing SpaceX to abort Starship launch | MSN | Jul 19 | −0.70 | −0.33 |
| Beyond rockets, SpaceX is quietly renting AI compute | Fortune | Jul 19 | +0.69 | +0.32 |
| SpaceX stock falls below its USD 135 IPO price | Wealth Professional | Jul 20 | −0.55 | −0.26 |
| Traders are increasingly betting against SpaceX | Financial Times | Jul 18 | −0.61 | −0.20 |
Contrib: contribution to the current reading, computed as relevance x |sentiment| x recency decay. A month-old FT story about the USD 400B value drop scores near zero here; this weekend’s launch abort dominates.
How to try it
No setup beyond connecting Bigdata.com to your assistant of choice:- Tool reference: Sentiment Tearsheet
- Connect it to Claude: Claude MCP integration guide
- Connect it to ChatGPT: ChatGPT MCP integration guide
- Microsoft Copilot and other agentic platforms: MCP introduction
find_securities, then bigdata_sentiment_tearsheet), but the point is that you don’t have to.
Choosing between them
Backtest or screen a factor
sentiment_pressure historically across your universe, join it to price, and test it like any other signal.Monitor a book programmatically
sentiment_pressure change, flag |sentiment_pressure| > 0.9 for review.Why did this stock move today?
Morning briefing on a watchlist
Try it on your own book
Everything above came from live API calls. The fastest way to evaluate the signals is against names you actually cover.- Zero-code start: connect the Bigdata.com MCP to Claude or ChatGPT and ask for a sentiment tearsheet on any name in your portfolio. Two minutes, no key.
- API access: request an API key and pull
sentiment_pressurehistory for your universe; the Entity Sentiment API reference has the full schema. - For bulk historical pulls across large universes, see the Smart Batching guide.
This content is for informational purposes only and does not constitute investment advice.

Francisco Gomez
Manager of Applied Intelligence (VP)

Andres Diaz
Senior Structured Data Manager