

October 20, 2026
Research, NVIDIA, Quant/9 minutes read
 Most investment teams consume datasets built around someone else’s taxonomy. Generic sentiment can describe whether an article sounds positive or negative, but it cannot answer a strategy-specific question such as: Is this company gaining market share from competitors?
This developer workflow moves the point of differentiation upstream. Researchers define the theme, retrieve the relevant evidence across a full equity universe, distill the judgment of a large reasoning model into a smaller model, and test whether the resulting labels contain information beyond sentiment. After retrieval, the proprietary text and model workflow remain inside the firm’s GPU environment.
Key benefits
- Create differentiated data: Define the classes and evidence rules around an investment thesis instead of adapting a generic vendor taxonomy.
- Retrieve at portfolio scale: Bigdata.com searches news and transcripts across thousands of companies.
- Keep inference private: Run teacher labeling, fine-tuning, corpus labeling, and signal construction on infrastructure controlled by the research team.
- Reduce recurring compute: Use the large reasoning model on a sample, then use the distilled student for full-corpus and subsequent labeling passes.
- Evaluate economic value: Compare the classified signal with a no-label, sentiment-only benchmark under the same portfolio construction.
- Preserve auditability: Materialize every stage as files so retrieval, labels, signals, and backtest inputs can be inspected or replaced independently.
Architecture
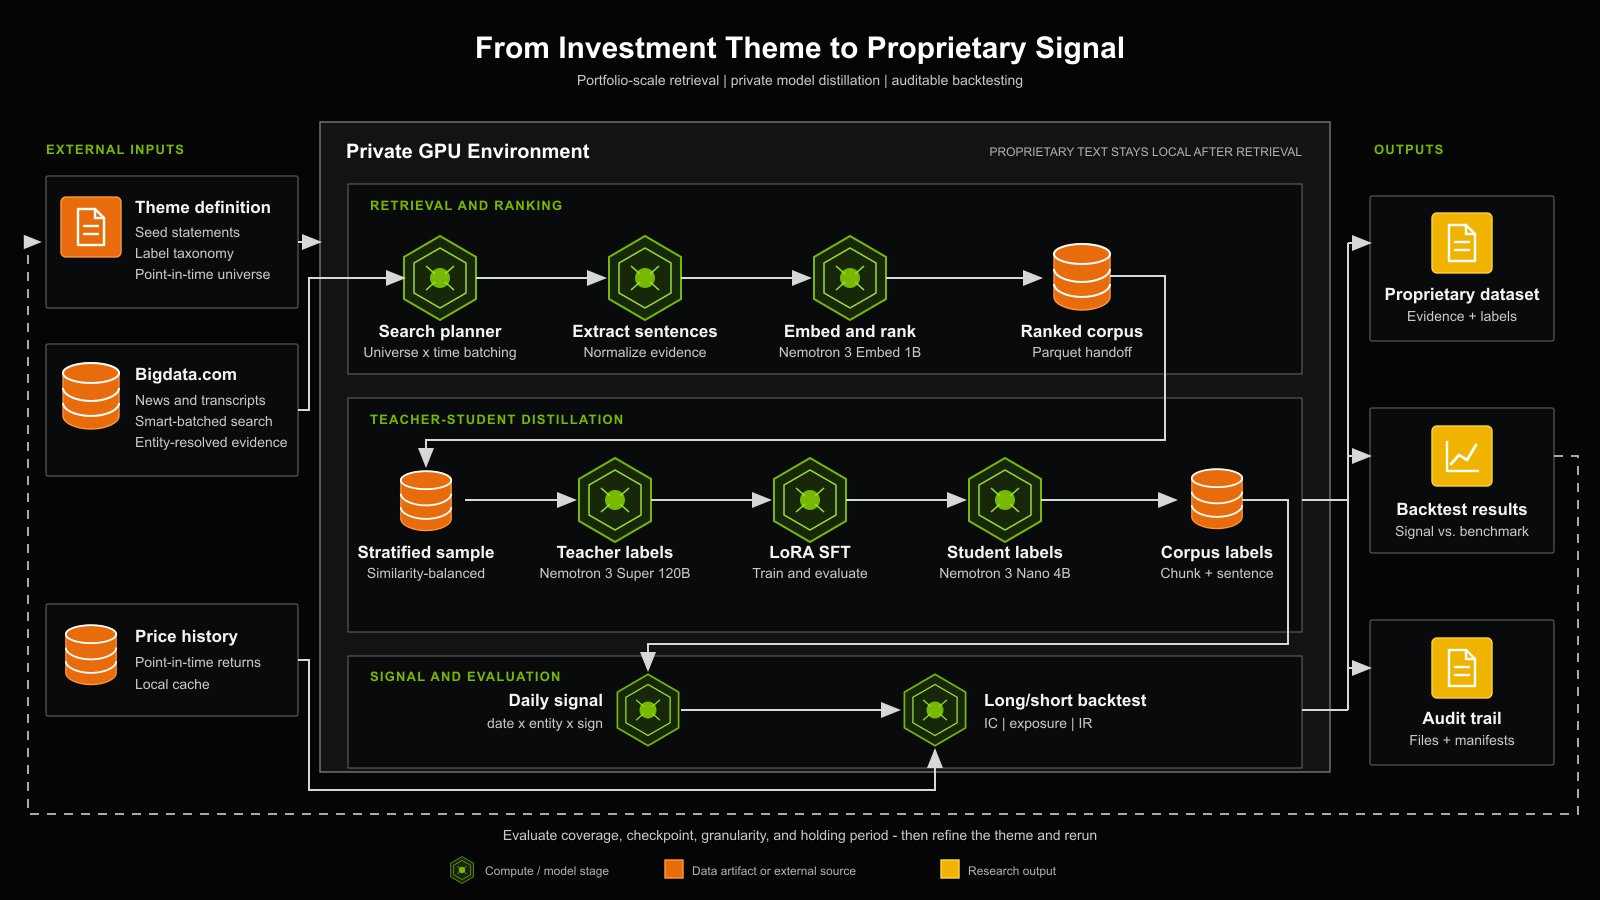
How the workflow works
1. Define the research question twice
A robust pipeline needs two related but distinct specifications:- Retrieval seeds describe how the theme appears in text. For market share, examples cover both gains and losses: improving win rates, customers switching from competitors, losing shelf space, or growing slower than the market.
- A labeling taxonomy defines the model’s decision boundary. The market-share taxonomy maps evidence to
gainer,loser, orirrelevantand explicitly rejects common near-misses such as absolute growth without a competitive comparison, industry-wide growth, or management plans without a realized outcome.
config/data_extraction.yaml. Abridged from the market-share run:
classes block is the only link between the taxonomy and the portfolio: each actionable class carries its trading sign, and null means no position. Everything below it is plain English the teacher model reads as its instructions.
This separation matters. Retrieval errors determine what evidence enters the corpus. Labeling errors determine what the dataset means. A downstream backtest cannot recover evidence that was never retrieved.
2. Retrieve and rank evidence across the universe
Bigdata.com searches a licensed archive of premium news and earnings-call transcripts across thousands of companies, without a query for every name in every period. Smart Batching plans queries around content volume and co-mentions rather than a full company-by-period grid. This implementation queries news and transcripts only, but the same search API covers the rest of the Bigdata.com content: regulatory filings, corporate communications such as press releases, expert-call interviews, podcasts, and investment research, all entity-resolved to the same company identifiers. Switching content types is a change tocombined_category in config/data_extraction.yaml, so a theme whose evidence lives in filings or expert calls rather than in news can reuse the rest of the pipeline unchanged.
The local pipeline then:
- Splits retrieved passages into sentences.
- Embeds the sentences and seed statements with NVIDIA Nemotron 3 Embed 1B.
- Computes similarity to the theme seeds.
- Ranks the corpus so coverage becomes an explicit research parameter.
3. Distill a large model’s judgment into a small model
Calling a large hosted model on every passage creates a recurring cost and sends proprietary text outside the research environment. The pipeline instead uses a teacher-student pattern:- Draw a stratified sample across the similarity distribution.
- Label that sample locally with NVIDIA Nemotron 3 Super 120B.
- Split the teacher labels into training and held-out evaluation sets.
- Fine-tune NVIDIA Nemotron 3 Nano 4B with LoRA supervised fine-tuning.
- Select a checkpoint using accuracy, macro-F1, rare-class recall, and class-count drift.
- Use the selected student to label the ranked corpus.
irrelevant is the majority class, so accuracy alone flatters any classifier on this distribution. In chunk mode, weighted labeling throughput rose from 7.4 rows per second for the teacher on the sample to 286.3 rows per second for the student on the full corpus, roughly 38.8x faster. Sentence mode is not directly comparable: one row can require several model calls.
4. Convert labels into a daily signal
The theme configuration assigns a sign to each actionable class:gainer = +1, loser = -1, and irrelevant contributes no position. Labels are aggregated to a daily (date, entity, signal) table using a point-in-time cutoff.
The reference implementation forms a 50/50 long/short portfolio with a 5% single-name cap and up to 160 names per leg. It also builds a sentiment-only benchmark from the same retrieved records, using relevance and sentiment but no custom classification labels. This is the correct baseline for determining whether the distilled taxonomy adds information.
5. Validate the signal, not just the classifier
High held-out accuracy does not prove investment value. The workflow therefore tests two different questions:- Predictive content: Pooled Spearman information coefficient measures whether the signal ranks subsequent returns.
- Portfolio behavior: Gross exposure, net exposure, active positions, turnover, return, volatility, and Information Ratio reveal whether a strong-looking result is caused by a thin or one-sided book.
Results from the reference market-share run
The comparison uses the same January 2016 to October 2026 price history for every row. The one-day half-life is applied to both classified books. The unsmoothed books are the same labels with no decay. The sentiment row is the unsmoothed benchmark built from Bigdata.com sentiment on the same retrieved records.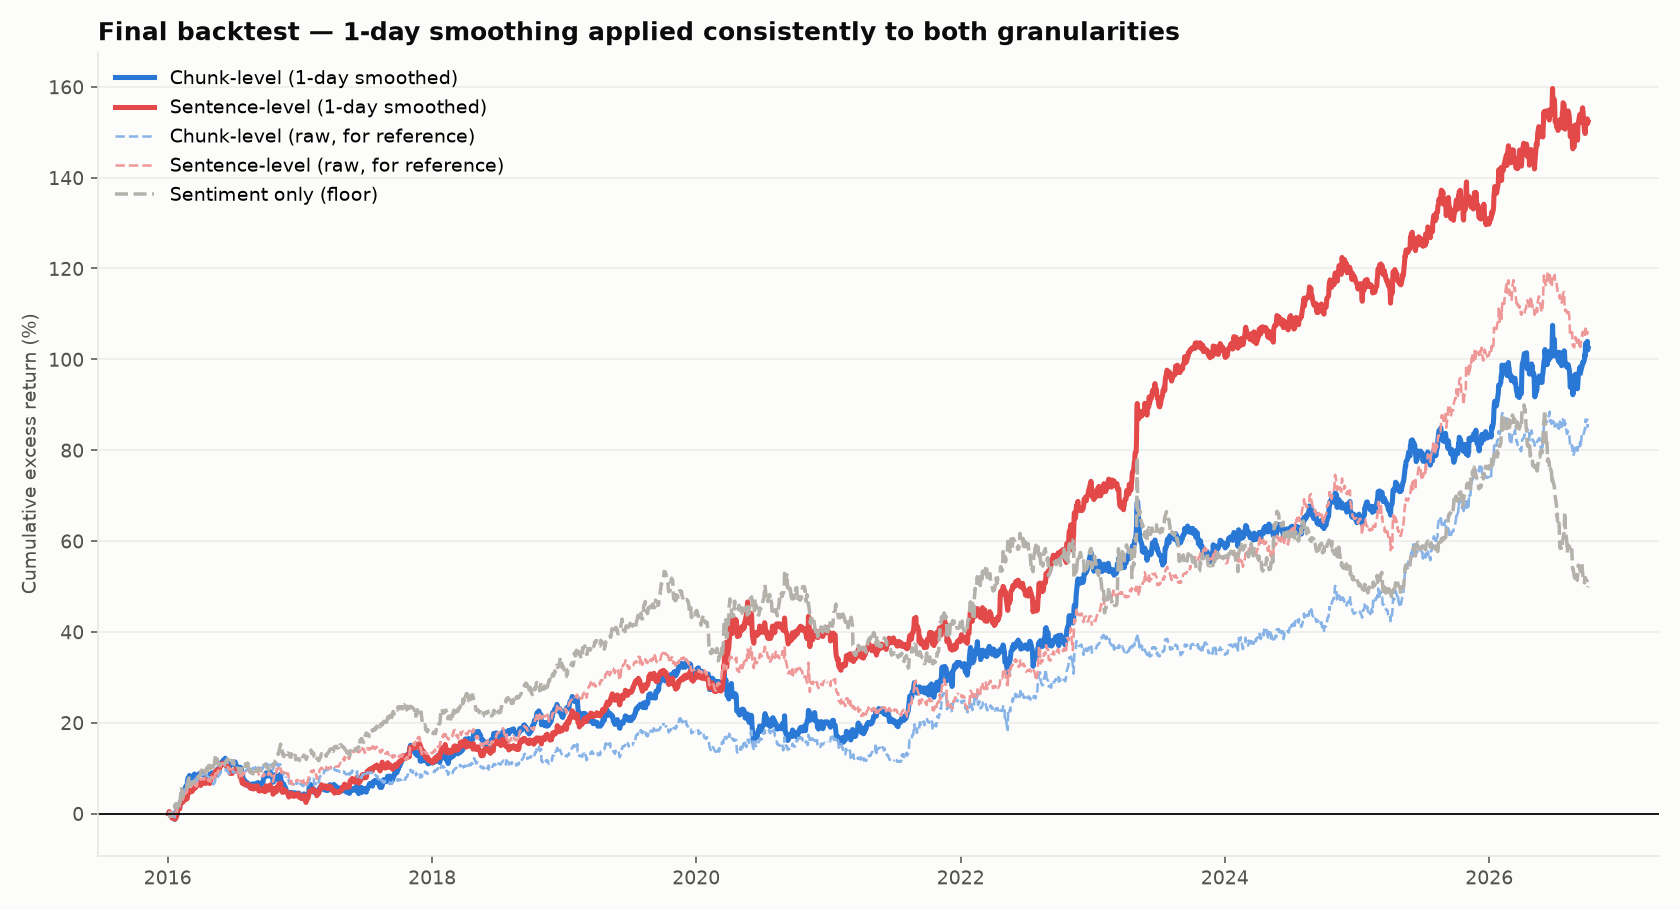
What is included
- A Jupyter notebook covering retrieval, labeling, distillation, evaluation, corpus inference, and backtesting
- Theme and model configuration files
- Resumable search, teacher, training, evaluation, and corpus-labeling stages
- NVIDIA Nemotron 3 Embed 1B semantic ranking
- NVIDIA Nemotron 3 Super 120B teacher serving
- NVIDIA Nemotron 3 Nano 4B LoRA fine-tuning and local inference
- Chunk-level and sentence-level labeling modes
- File-based interfaces for bringing your own corpus or prices
- A long/short backtest and sentiment-only benchmark
- Information-coefficient and holding-period checks across coverage levels
Tested environment
- Python 3.12 or later
- Docker for model serving and training containers
- 2x NVIDIA H200 NVL (PCIe), serving the 120B NVFP4 teacher across both devices and later the fine-tuned 4B student. This is the configuration the reference run used, not an established minimum.
- Sufficient local storage for model weights, retrieved passages, labels, and price caches
- A Bigdata.com API key for retrieval
- A local price cache in the documented format (daily returns per company) for the backtest
Software used
NVIDIA technology- NVIDIA Nemotron 3 Embed 1B
- NVIDIA Nemotron 3 Super 120B A12B NVFP4
- NVIDIA Nemotron 3 Nano 4B BF16
- CUDA-enabled local model serving and distributed training
- Bigdata.com Search API and bigdata-smart-batching library
- PyTorch, Transformers, PEFT, and TRL
- pandas, NumPy, and PyArrow
- Jupyter
- A price-history dataset
Get started
Open the dataset-generation pipeline notebook. Two places need editing. Inconfig/data_extraction.yaml:
- the classes and their trading signs
- the labeling taxonomy
- the investable universe
- positive and negative retrieval seeds
- the search period
TOP_FRACTION, the share of the ranked corpus the student labels (0.2 in the reference run)
Resources
- Bigdata dataset-generation repository
- NVIDIA AI Model Distillation for Financial Data
- NVIDIA Quantitative Signal Discovery Agent
- Bigdata.com

Francisco Gomez
Manager of Applied Intelligence (VP)

Francesco Ricigliano
Data Scientist