Why It Matters
Traditional RAG and search workflows are built for a handful of entities at a time: you point at a few tickers or names, run a query, get results. Scaling to a full universe (e.g. Global All-Cap, ~10,000 names) means orchestrating thousands of HTTP requests: per-query rate limits (QPS), connection pools, retries, backoff, and timeouts become your problem. You either throttle down and wait, or you push QPS and risk 429s and failed runs.What It Does
The Batch Search API removes that burden. You submit one file with your queries. The service processes them asynchronously and returns one result file. No client-side loops, no QPS management, no thousands of round-trips.How It Works
This guide walks you through a complete workflow:- Load a universe from a CSV and configure topic and time range
- Build queries and submit a single batch job (create, upload JSONL, poll, download)
- Post-process results with by-query chunk assignment and aggregate scores
- Inspect top positive and negative companies, top chunks for the most negative, and a sector–country heatmap as a bottom-up macro indicator
A Real-World Use Case
We ask how the Global All-Cap universe (10,000 companies) has been affected by a given topic (e.g. Trump administration policies) over a recent window (e.g. the last six months). The goal is a ranked list of top-affected names and bottom-up macro signals (a sector–country heatmap) grounded in document-level evidence. Topic used in this guide: “The company is affected by the Trump administration’s policies.” (Configurable in section 3) Ready to get started? Let’s dive in!1. Setup
Load dependencies and paths. Authentication usesBIGDATA_API_KEY from .env. We also define where the universe CSV and result files live.
Imports and setup
Imports and setup
2. Load the Global All-Cap universe
Read the universe CSV. ColumnsRP_ENTITY_ID, COMPANY_NAME, COUNTRY, and SECTOR are used to build queries (10 entities per query) and later to join results for the sector–country heatmap.
3. Configuration: topic and time range
Set the search topic (e.g. companies affected by the Trump administration’s policies) and the time window (ISO timestamps). These are applied to every query in the batch.4. Build queries
Here we generate one query per group of 10 companies from the universe, usingentity.any_of to provide the list of entity IDs. Each query uses the same topic, filters, and time window. This is specific to this example, but the service can handle queries with entirely different filters, topics, and time ranges within the same batch job.
For a universe of 10,000 companies, this approach yields 1,000 total queries, all sent together in a single batch job. In principle you could generate one query per company (10,000 queries), but that can substantially increase total latency and many smaller companies may return few or no hits. Batching entities (e.g. 10 per query) keeps the job size manageable. An optimal approach is to group companies with similar levels of media attention together within each batch, so high-visibility names do not dominate and smaller companies have a better chance of returning relevant results.
The filter settings here aim for precision: an entity control filter for Trump (22C3AF) and a reranker threshold of 0.7 favor more relevant results but may reduce recall. Other use cases may opt for higher recall and apply verification (e.g. via LLMs) in post-processing.
5. Submit one batch job
This section handles the end-to-end process of submitting a batch search job to the API. The steps are:- Create a new batch job on the API. You receive a batch job ID and a presigned URL to upload the queries.
- Upload the queries (packed as a JSONL string) using the provided URL.
- Poll until the batch job status is marked complete.
- Extract the final output location from the API’s status response.
- Download the results from the provided URL and save them to disk (e.g. in
results/, using a filename based on the batch ID).
Full batch submit and download
Full batch submit and download
6. Post-processing: deduplicate chunks, entity detections, join to universe, aggregate
In this step we post-process the batch API results to obtain entity-level metrics. The goal is to combine both the quantity of media attention (how many relevant chunks mention each entity) and the qualitative sentiment of those mentions. We first deduplicate chunks by their unique identifiers (each(doc_id, cnum) pair) so each passage is counted once. We assign each chunk only to entities that were in the query’s entity.any_of for the response line that returned that chunk, and that also appear in the chunk’s detections and in our universe. That avoids co-mention bias: each chunk contributes only to the entities we asked about in that query. We then cross-reference entity IDs with the universe to attach SECTOR, COUNTRY, and COMPANY_NAME.
We build a long table: each row is a chunk–entity pair with relevance and sentiment. The core aggregation is a score per entity: the sum of (sentiment × relevance) over all associated chunks. That captures not only how often an entity is mentioned but how strongly and in which direction. It also weights mentions by relevance to the search theme. The result is a wide table: one row per entity (with at least one chunk), with score and metadata. Because we sum (not average) sentiment × relevance, scores are unbounded and reflect total weighted sentiment. This table supports rankings and sector–country heatmaps where each cell reflects both strength and breadth of media attention.
Post-processing code
Post-processing code
7. Results and visuals
Top 5 positive and top 5 negative by score
A single, broad topic prompt was enough to surface 1,847 companies (19% of the top 10,000 publicly listed globally) in chunks linked to Trump policies, illustrating the approach’s value for global screening. To illustrate the most notable cases, we showcase the top 5 positive and top 5 negative entities in terms of score. The chart below presents these results, with the five most negative scores (shown in red, on the left) and the five most positive scores (shown in green, on the right). The score for each company is calculated by summing the product of sentiment and relevance across all its chunks.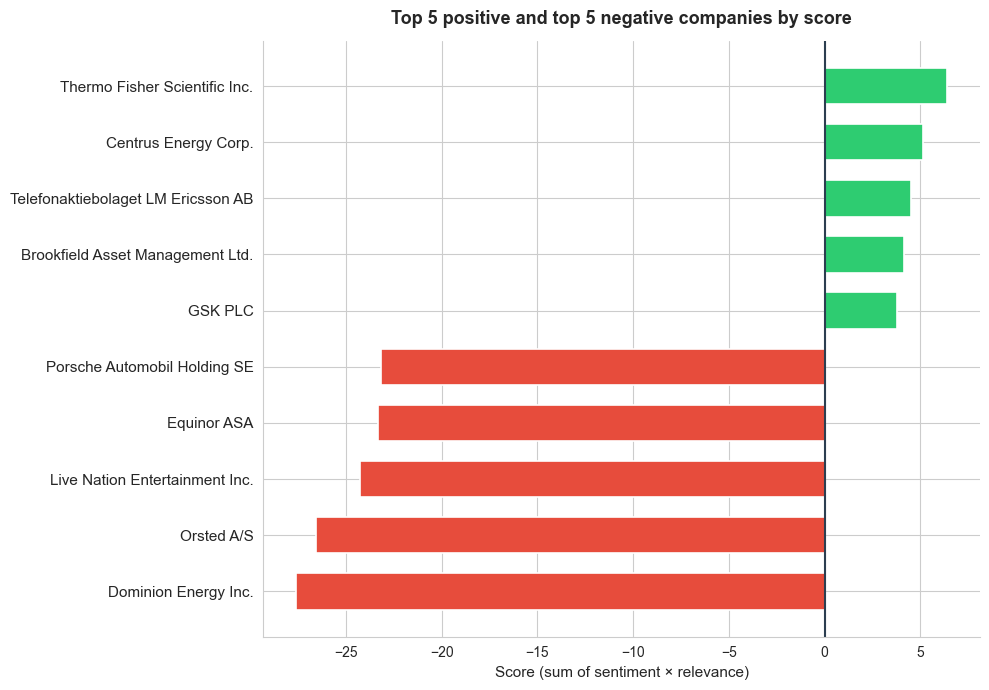
Top chunks for the most negative company
To explore what underlies the scores, we can select and display the top chunks (ranked by relevance) for the company with the lowest aggregate score. Each row shows the full chunk text along with relevance and sentiment for that chunk. Sentiment is computed at the chunk level. Additional weighting or advanced techniques can be applied to improve entity-level accuracy and interpretability.Dominion Energy Inc. (top 5 chunks)
| Relevance | Sentiment | Chunk Text |
|---|---|---|
| 0.985 | -0.85 | Dominion Energy (NYSE:D) closed -2.7% on Monday after the Trump administration ordered Danish wind farm owner and operator Ørsted to halt all activities on its Revolution Wind project off the coast of Rhode Island, which is under construction |
| 0.975 | -0.63 | 1% this hour. Independent power producers, Vistra and Constellation Energy are both down right now. Constellation by as much as 10%. Dominion Energy can restart construction of a wind project off the coast of Virginia while it continues a legal fight over the Trump administration’s order to stop the $11 billion development. A federal judge issued a preliminary injunction today blocking the government from enforcing its stop work order after Dominion claimed it was suffering irreparable harm. The company says it’s losing millions every day that project sits idle. And OpenAI will start testing advertisements in its chat GPT app, marking a major shift for the company as it seeks to bolster revenue and offset some of the costs associated with building and supporting AI. The ads will appear in the coming weeks for some U.S. users who use its free version as well as its newer low-cost go plan. That one costs about eight bucks a month. More expensive plans will go ad-free. |
| 0.968 | -0.79 | Investment management platform Builder Clearwater Analytics added 8% after agreeing to be acquired by private equity firms Permira and Warburg Pincus for $8.4 billion, including debt. And now, Monday’s Unfortunates. Trump Media and Technology Group lost nearly 14%. Dominion energy shares fell nearly 5% after the Trump administration halted five East Coast wind projects, including Dominion Energy’s coastal Virginia offshore wind. In Stokart, parent Maple Bear dropped more than 3% after it said it would end the use of artificial intelligence-driven pricing tests for its grocery platform. The pricing tests had caused some customers to pay more for identical items in the same store than other customers. Shares of Dollar Tree fell 4.2%, Meme Stock GameStop dropped 3.5%, and Honeywell shares fell more than 1% after a regulatory filing stated that it expects to take a one-time charge in the fourth quarter, lowering gap sales by $310 million, and operating income by $370 million. That’s all for today. My name is Tony Jackson, and we’ll talk more stocks tomorrow. |
| 0.946 | -0.72 | Dominion Energy (D) shares fell 3.7%. The Trump administration paused the lease for the company’s Coastal Virginia Offshore Wind project, along with four other projects under construction in the US, citing national security risks. |
| 0.946 | -0.80 | On Monday, the Trump administration ordered Dominion Energy Inc. (NYSE:D), which owns the Coastal Virginia Offshore Wind, alongside other wind developers, to temporarily halt their construction of wind projects amid national security concerns raised by the Pentagon. |
Bottom-up macro indicators
The large-scale batch is especially powerful here. We aggregate entity-level scores by sector and country to create bottom-up macro indicators. We build a heatmap using all sectors and a G12 selection of countries. Each cell shows the sum of score over entities in that sector–country. Color scale: blue = negative, white = neutral, red = positive. For a topic like “how companies are affected by the Trump administration’s policies,” this heatmap surfaces which sector–country combinations are most negatively or positively associated with media coverage and sentiment. Sectors and countries with strongly negative scores may indicate higher exposure to regulatory, tariff, or policy risk. Strongly positive ones may reflect perceived benefits or resilience. The view is built from entity-level evidence rather than pre-aggregated statistics, so it stays grounded in the underlying documents and chunks returned by the Batch API.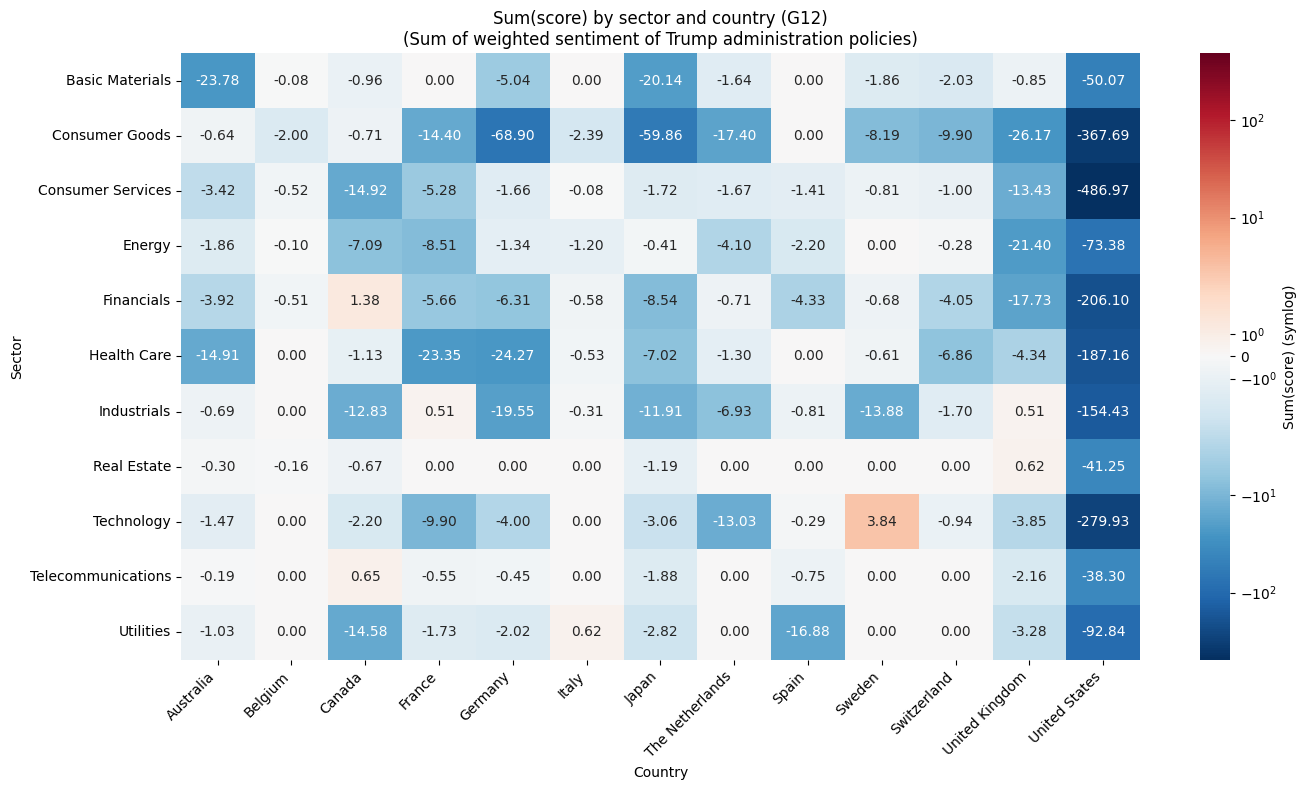
Practical Applications
This kind of enterprise-strength data processing opens up possibilities that simply aren’t available when you’re limited to a few searches:- Global All-Cap thematic screening: Run one batch job to score how the full Global All-Cap universe (or any large universe) is affected by a topic, e.g. policy shifts, tariffs, or sector-specific events, then rank companies and build sector–country heatmaps from document-level evidence, as demonstrated in this guide.
- Comprehensive market sentiment: Track sentiment across the entire Russell 1000 or any equity universe on a regular cadence. Quickly identify names where coverage is turning positive or negative, and aggregate to sector or country level for a top-down view.
- Macro and country-level monitoring: Screen sovereign entities, central banks, or country-tagged news to build bottom-up macro indicators, e.g. policy-risk scores per country, fiscal-sentiment heatmaps, or cross-border contagion signals, without relying on pre-aggregated macro data.
- Supply chain and geopolitical risk: Detect early warnings across global supply networks by screening thousands of suppliers, logistics providers, and raw-material producers in one batch. Flag concentration risk by geography or sector before disruptions propagate.
- Competitive intelligence: Monitor every competitor and adjacent industry simultaneously. Score how a product launch, regulatory ruling, or M&A rumour affects each name in a peer group and compare exposure across sectors.
- Regulatory and policy impact: Analyze how new legislation, sanctions, or trade policy affects every sector at once. Aggregate entity-level scores to a sector–country heatmap to see where regulatory risk concentrates.
- Extension to other asset classes: The same workflow applies beyond equities. Screen commodities (e.g. metals, energy, agriculture) or FX pairs by replacing entity IDs with commodity or currency entities and adjusting the topic. For example, score how tariff announcements affect the full commodity complex, or how central-bank rhetoric shifts sentiment across G10 currencies. One batch job, same post-processing pipeline.