Why It Matters
Research teams need monitors that are fast to stand up, easy to audit, and tied to real sources, not one-off LLM prose. Wiring agents to dozens of APIs and normalizing responses is brittle. Remote MCP exposes Bigdata.com search and tearsheets as consistent, metadata-rich tools so you spend effort on schema and questions, not plumbing. You can ship a topic-specific dashboard in hours when your dimensions are covered by the platform.What It Does
The pattern produces a self-contained front end (for example React) whose numbers and narratives come only from embedded constants populated each cycle. An LLM maps tool outputs into a strictGROUNDED_DATA contract, validates freshness, updates the source file with surgical edits, runs a build, and deploys static assets. Panels can combine real-time-style benchmarks from bigdata_market_tearsheet, evidence from bigdata_search (headline, source, timestamp, document ID, URL, chunk), and macro context from bigdata_country_tearsheet. You can walk through the same layout in code using the open-source MCP_Dashboard_Demo folder in bigdata-cookbook.
Ready to get started? Let’s dive in!
How It Works
High level:- Automation triggers a run from your agent instructions (in the MCP_Dashboard_Demo tree, that includes
update-dashboard.md,spec/, andskills/). - First call is typically
bigdata_market_tearsheetfor cross-asset and energy baselines, then parallelbigdata_searchqueries (with optional follow-ups), plusbigdata_country_tearsheetper country you track. - The agent maps results into
GROUNDED_DATA, checks that values trace to this cycle’s tool outputs, then updates the dashboard artifact. - CI runs a build before merge; push deploys static hosting. Refresh equals redeploy, not a live query from the browser.
Architecture
Scheduled automation invokes an LLM that reads Bigdata.com MCP tools, writes grounded data into the dashboard source, and deploys via CI.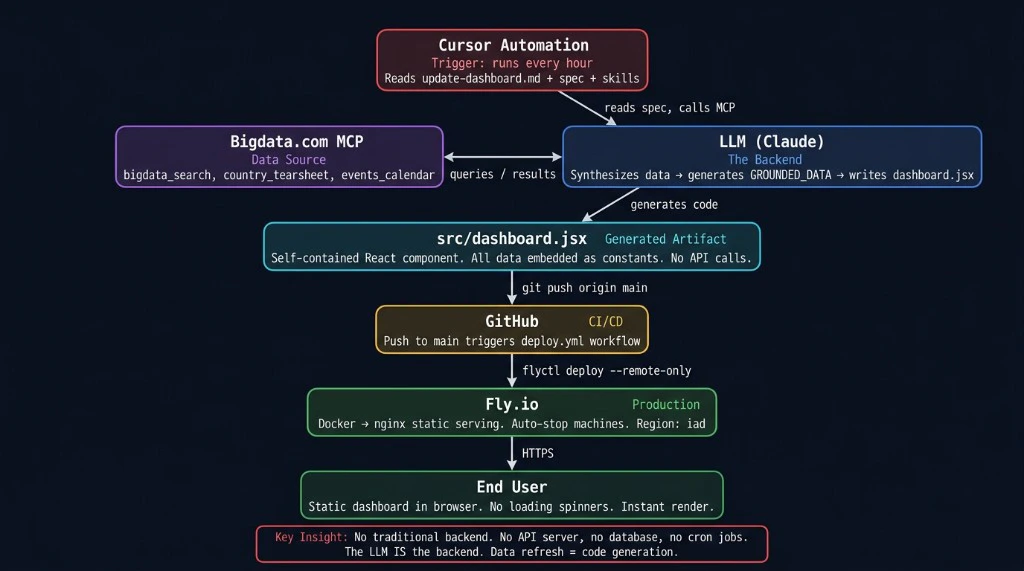
Data contract
The UI reads only fromGROUNDED_DATA embedded in the bundle. In the demo repo, the authoritative object lives in src/dashboard.jsx. Abbreviated TypeScript sketch for the reference build:
Refresh cycle
Typical wall-clock duration is on the order of 5-10 minutes depending on environment:- Market tearsheet first to set price baselines.
- Search batch in parallel (for example ten queries) and limited adaptive follow-ups if the schema is incomplete.
- Synthesis into
GROUNDED_DATAwith per-field traceability to this cycle’s MCP results. - Freshness pass: no silent carryover; gaps become
[STALE]with timestamp. - Targeted file edits to the dashboard source, then
npm run build(or equivalent) before commit. - Commit, push, static deploy, with no application database on the hosting tier for data refresh.
Attribution mapping
Forbigdata_search chunks, map headline, source.name, timestamp, id (RP_DOCUMENT_ID), and url when present into SourceObject. For market data drawn from the tearsheet, use a fixed citation row (for example id MARKET_TEARSHEET and URL bigdata_market_tearsheet).
Feedback between runs
Append structured notes (what worked, issues, follow-up query ideas) tofeedback/cycle-log.md (same path as in MCP_Dashboard_Demo) and commit them with the artifact. The next run reads that file as handoff context: an audit trail, not model training.
MCP tools in this pattern
MCP Introduction
Remote MCP overview and full tool list.
A Real-World Use Case
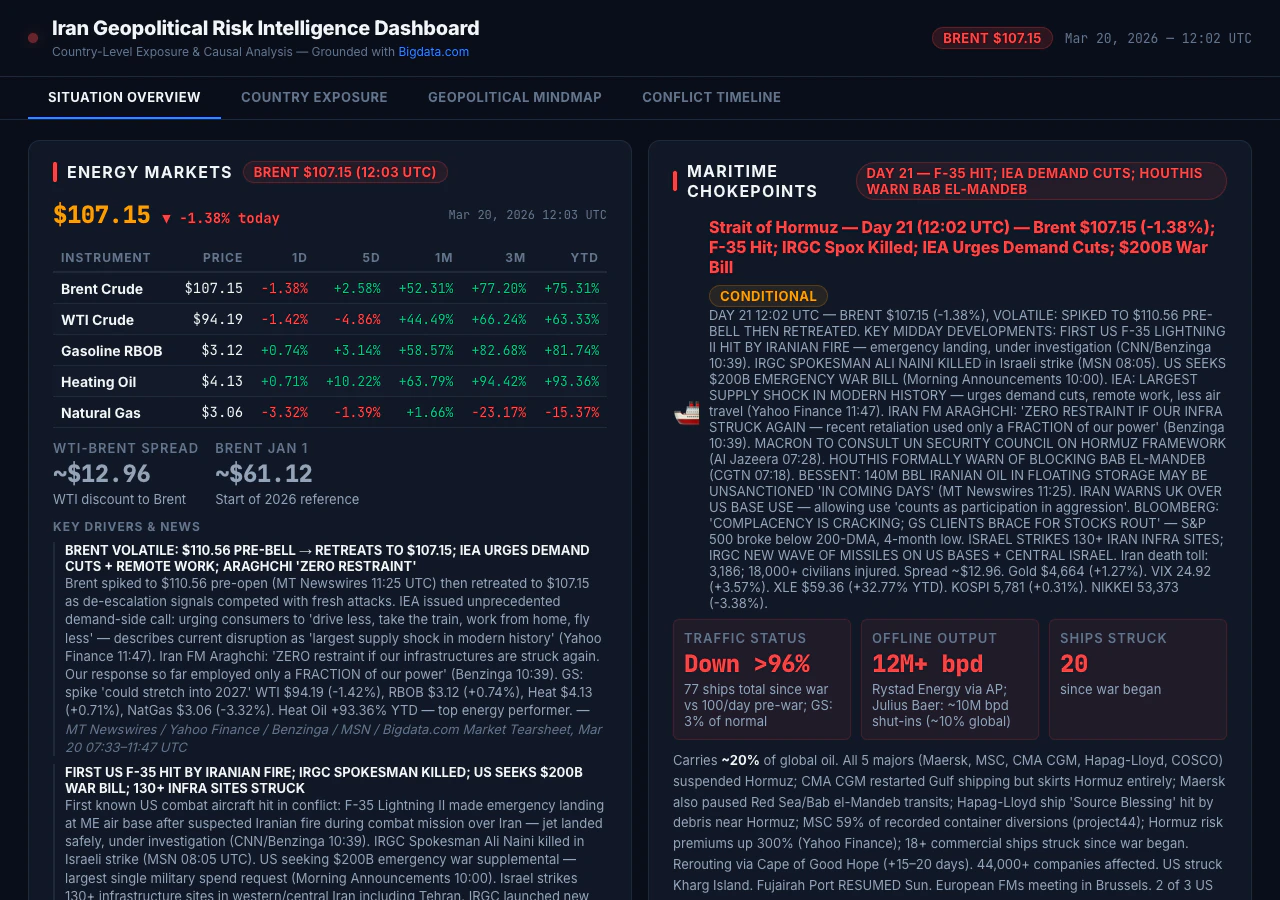
The Iran geopolitical risk dashboard illustrates end-to-end depth for one theme: energy markets and chokepoint risk, exposure across ten economies, analyst-style scenario bands with citations, and a five-domain causal mindmap with confidence. Figures change every successful refresh; treat any numbers in prose here as illustrative of layout, not as live data. What this dashboard surfaces:- Energy benchmarks (Brent, WTI, products, gas) with multi-period performance from the market tearsheet, plus narrative drivers from search.
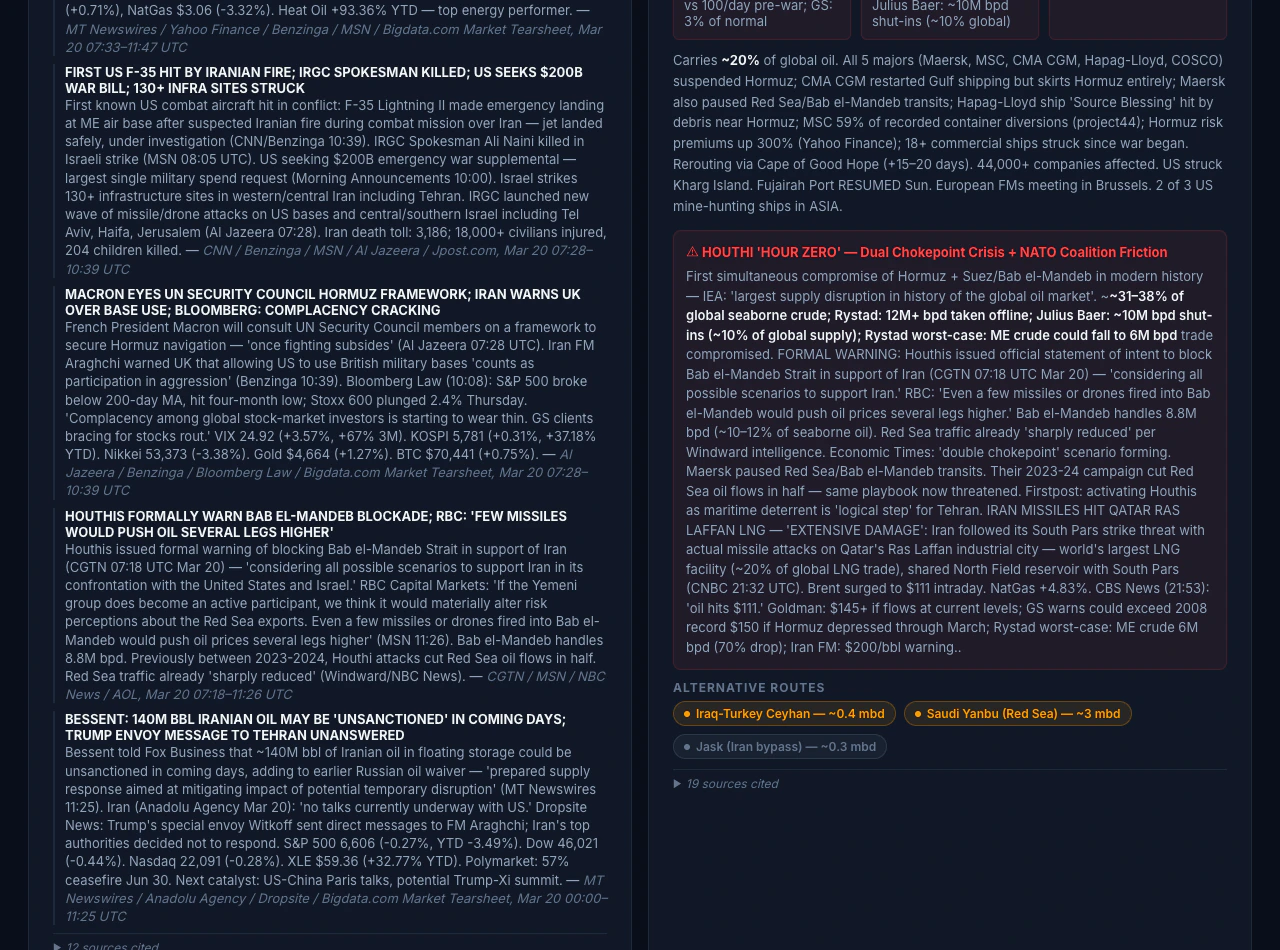
- Hormuz and dual-chokepoint context from search-grounded shipping and policy reporting.
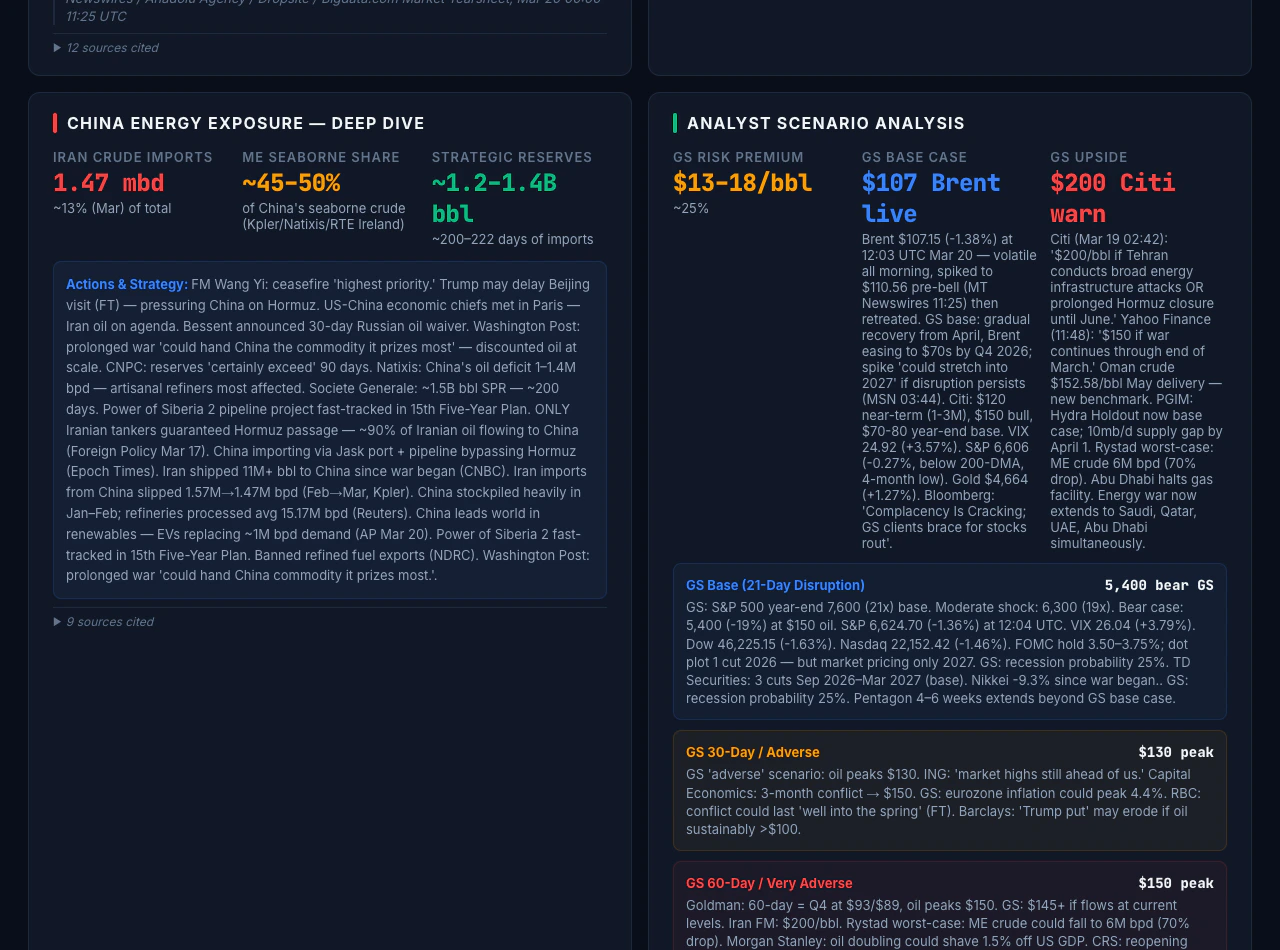
- Country exposure: dependency, transit, and reserve-style framing, plus central bank and policy updates where relevant, contrasted with country tearsheets where used.
- Scenario panels cited to research surfaced in search during that cycle.
- Mindmap nodes tied to evidence from the same cycle, not free-form model memory.
The live site reflects the latest published snapshot. Set refresh cadence to match your use case (from frequent runs when markets are moving to longer intervals for slower-moving themes), or run updates on demand. Content is informational only and may lag real-world events between runs. Combining this synthesized, static view with a live news-style stream or terminal would typically require a traditional backend (APIs, WebSockets, or polling) alongside this MCP-and-static pattern, not the static approach alone.
Screenshots
Reusing the pattern
Define yourGROUNDED_DATA shape, your bigdata_search query set, tearsheet usage (market plus per-country calls), and the mapping from schema keys to UI sections. Then automate cycles and keep builds mandatory before deploy. Other themes teams often consider include Taiwan Strait shipping stress, European energy security, EM sovereign credit pressure, and sector-level earnings surprise monitors, provided Bigdata.com covers the entities and content you need.
To run the demo locally, clone MCP_Dashboard_Demo and follow its README for Node.js 20+, npm, npm ci / npm run dev / npm run build / npm run preview, Docker, and optional CI samples under docs/reference-workflows/. Configure Bigdata.com API access and MCP using Build your own MCP. Treat the cookbook folder as an illustration: the README describes when the tree is a frozen snapshot versus a separate production deploy, so the clone may not match the live public site or the latest cycle logs.
Stack snapshot (reference)
| Layer | Piece |
|---|---|
| Prices / cross-asset | bigdata_market_tearsheet |
| Evidence | bigdata_search |
| Macro | bigdata_country_tearsheet |
| Synthesis / codegen | Your agent and LLM |
| Schedule | Your automation (scheduled or on-demand agent runs) |
| Hosting | Static site; refresh via redeploy |
| Notes across runs | Structured cycle log in repo |
Real-time and insights trade-off
This pattern is not a news terminal: it does not stream headlines or refresh continuously in the browser. Each deploy is a static snapshot from the latest successful pipeline run, so coverage is batch-oriented and auditable, not a live tape. Use it where sourced, periodic intelligence matters more than tick-level prices or uninterrupted news flow. What you gain instead is synthesized briefings with full source attribution (document IDs, timestamps, URLs), plus structured reasoning in the UI (scenarios, exposure matrices, causal views) that a headline stream does not assemble. That combination refreshes on your pipeline cadence or on demand, rather than tick-by-tick.Get started with Remote MCP
Live dashboard
Open the Iran geopolitical risk dashboard.
Developer Platform
API keys and usage for Bigdata.com services.
Claude (OAuth MCP)
Connect Claude to Bigdata.com Remote MCP.
ChatGPT (OAuth MCP)
Connect ChatGPT to Bigdata.com Remote MCP.
MCP with API key
Integrate agents using your API key.
Bigdata.com
Product overview and access for your organization.
For access to Remote MCP and Search, use the Developer Platform or contact Bigdata.com for a demo.